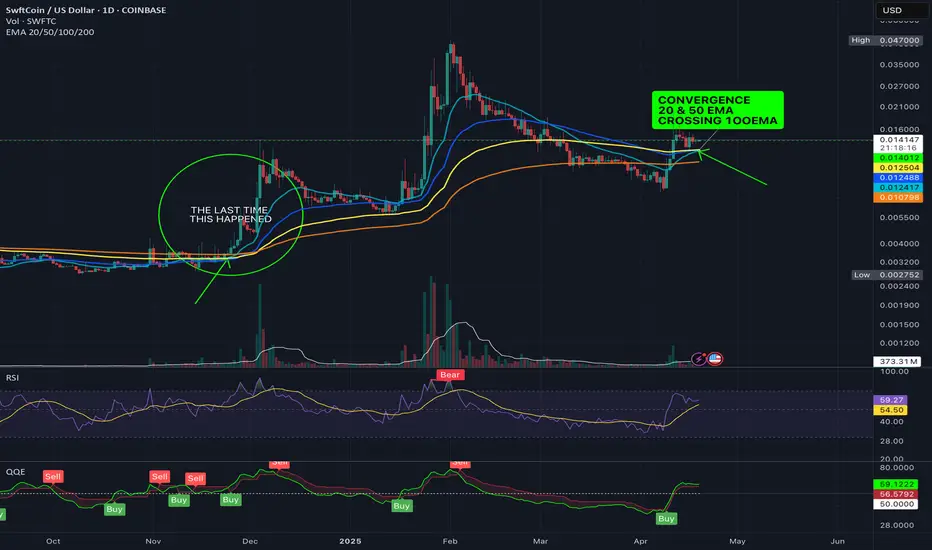
SWFT Convergence - 20/50 EMA Crossing 100 EMAIm not saying that its something, but it sure as hell isnt nothing. The last time this happened the price rose significantly. Thsi should happen over the next 24-48 hours so, we'll see.
Not financial advice
SWFTCUSD trade ideas
potential bullish movementjudging by previous pattern, potential bullish movement in the near future

swftc swftc always dumps 70-78% before the next leg higher.. i wouldnt be bullish at 2c.. wait for cheaper prices.. next top 6-8c


Swift breakout taIn this description you'll see a bounce from this bullish pennant. Tell me different

SWFTC - Update: Holding above 200maHello Followers,
We are on pace to hit out goal.
Holding above the 200ma, MACD looking more bullish.
RSI is getting a bit high though.
The next 4-5 hours will make our goal or retrace back down to lower support.
Lets get this money!
GoldenRule
SWFTC looking more bullish to hit our targetFuture getting more bright as it ticks up consecutive green candles to retest our target.
US job report should boost this into a Bullish Friday. Selling point would be near 5pm PT
A breakout above the top parallel is vital to hit our goal.
Lets get this money!!!!


Ascending Triangle breakout for SWFTCoin!Is there an Ascending Triangle hiding among the bearish patterns being displayed...
Or is momentum fading....

Rising Wedge Pattern For SWFTCoin.... Hidden Ascending Triangle!The rising wedge is a chart pattern used to identify possible reversals.
The pattern appears as an upward-sloping price channel featuring two converging trend lines.
It's usually accompanied by falling trading volume.
Wedges can either form in the rising or falling direction.
A rising wedge is often considered a bearish chart pattern, meaning it indicates a breakout to the downside.
Be careful of a shakeout-fake-out.
It appears as though an Ascending Triangle is hiding in the shadows.
It is very common for whales to accumulate at the bottom of these patterns..
glta

SWFT is showing bullish strength upon breakout of bullish flag!It appears as though the RSI is cooling off and SWFT may consolidate in the .035c-0.030c range before the next leg up....
One thing I have noticed is the price does not consolidate for too long which indicated a whale or two are gobbling up any SWFT they can get their hands on...
Expect a gap up to the top of the ascending channel in the immediate term.
Where are all my Swifties at!!!
If we do see a sell off I dont expect the price to stay in the 0.03c range for very long.
Don't swim against the current, ride the wave & be brave!

SWFTC/USDT Analysis$SWFTC is breaking through the red resistance zone.
🎯 Targets to Watch:
1️⃣ First Target: Green line level
2️⃣ Second Target: Blue line level

Bull Flag breakout for SWFT!!!SWFT appears to be showing bullish strength over these recent months..
Sell offs get gobbled up....
The williams alligator is trending upward which is inherently bullish.
SWFT is consolidating into a bullish flag or bear flag.
The downward sloping resistance has been tested over half a dozen times, the base of the pattern coincides with the previous high...
Price target of 4c in the near term.

Swiftcoin shortGot 5 waves up, the last wave 5 had a bullflag with a target exactly where it is now. So 5 waves up, last wave 5 also 5 waves. Now need some abc correction. Let me know what you think

SWFTC Up 100% - I am a long term bull! Morning Folks! I entered into SWFTC yesterday, today it is up 102%. Expect a retracement to .02 then double from there.

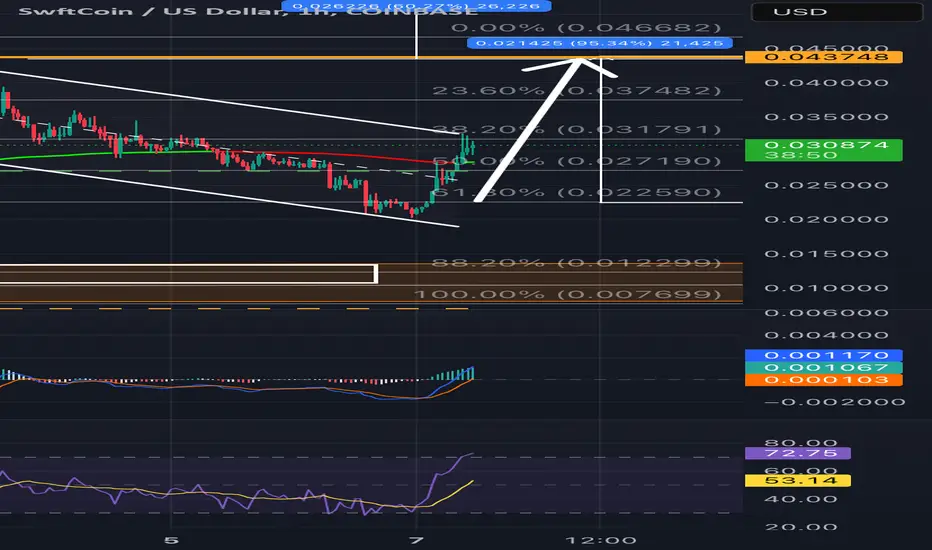
$SWFTCUSD Fibonacci countNot Financial Advice..
This is just a study NOT financial advice. It seems like it complete the move on wave 3. if it doesn't break below yellow line will create a consolidation (wave 4) before it resumes for a new move up (wave 5)

$SWFTC Retesting top of channelNot financial advice.
$SWFTC Is going to retest the top of the channel also aligns with Fibonacci retracement. will see if it bounce for the upside.
Like and subscribe for more ideas.
Thank you.

SwiftCoin AccumulationSWFT looks to be accumulating and holding its own above the AVWAP. Decreasing spread with demand tests at the symmetrical confluence usually means a markup is on the books. Let's see what happens here. I'm jumping in with a low-dollar preliminary just in case and will feed the position if it runs. Best case scenario is it runs to the 1 Fibonacci, then retraces back into TR to raid the stops so I can juice the pullback. This is what I teach my group. By that point it will have proven itself.
Not financial advice.
Have fun, stay safe in the markets!
Like making money trading crypto? Be sure to subscribe and never miss another swing chart!

(SWFTC) swft blockchain "most active in China"
data according to www.crunchbase.com, data measured monthly.
most active in China.

Swiftcoin Ready to Pop?!Swiftcoin is showing hidden bullish divergence on the daily time frame. Price broke out of a falling wedge pattern and is retesting the 10EMA. Looks like a nice set-up.

Swft CoinChart is clear as day , previous accumulation, resulted in explosion.Bigger bull flag pattern and further accumulation. Company is in early stage partnership with moneygram.Case for this coin is stable swapping and alternative crypto exchange platform.Only worries may be that the market has no love for Chinese platforms.Regardless good movement and convincing pattern


swft about to make a huge runlow cap high volume. this thing can fly. currently the volume is almost twice its market cap
