SXPUSDT 1WSXP ~ 1W Analysis
#SXP Buy back gradually from here with a short -term target of at least 20%+ from here.
SXPUSDT trade ideas

SXPUSDT | Today's Best Volume Gainer - Resistance AheadSXPUSDT has seen a significant volume surge today, making it one of the most actively traded coins. However, there is no reason to be bullish right now. Instead, we focus on key resistance zones for potential short opportunities.
🔴 Key Resistance Zones:
The red boxes mark strong resistance areas where sellers are likely to step in.
Low time frame breakouts will be closely monitored to confirm short opportunities.
⚠️ What Would Change My View?
If we regain these levels with strong volume and a proper retest, I might reconsider a bullish approach.
Until then, the smartest strategy is to wait for confirmation and short from resistance zones.
📌 Why You Should Pay Attention to This?
I don’t trade blindly - these levels are carefully calculated using volume footprint and time price opportunities. Most traders don’t even know about these advanced techniques, which is why my success rate is unmatched. You can check my profile and see the results for yourself.
👉 Stay disciplined, trade with confirmations, and don’t fall into emotional traps. The market will tell us what to do—we just need to listen!
📌I keep my charts clean and simple because I believe clarity leads to better decisions.
📌My approach is built on years of experience and a solid track record. I don’t claim to know it all but I’m confident in my ability to spot high-probability setups.
📌If you would like to learn how to use the heatmap, cumulative volume delta and volume footprint techniques that I use below to determine very accurate demand regions, you can send me a private message. I help anyone who wants it completely free of charge.
🔑I have a long list of my proven technique below:
🎯 ZENUSDT.P: Patience & Profitability | %230 Reaction from the Sniper Entry
🐶 DOGEUSDT.P: Next Move
🎨 RENDERUSDT.P: Opportunity of the Month
💎 ETHUSDT.P: Where to Retrace
🟢 BNBUSDT.P: Potential Surge
📊 BTC Dominance: Reaction Zone
🌊 WAVESUSDT.P: Demand Zone Potential
🟣 UNIUSDT.P: Long-Term Trade
🔵 XRPUSDT.P: Entry Zones
🔗 LINKUSDT.P: Follow The River
📈 BTCUSDT.P: Two Key Demand Zones
🟩 POLUSDT: Bullish Momentum
🌟 PENDLEUSDT.P: Where Opportunity Meets Precision
🔥 BTCUSDT.P: Liquidation of Highly Leveraged Longs
🌊 SOLUSDT.P: SOL's Dip - Your Opportunity
🐸 1000PEPEUSDT.P: Prime Bounce Zone Unlocked
🚀 ETHUSDT.P: Set to Explode - Don't Miss This Game Changer
🤖 IQUSDT: Smart Plan
⚡️ PONDUSDT: A Trade Not Taken Is Better Than a Losing One
💼 STMXUSDT: 2 Buying Areas
🐢 TURBOUSDT: Buy Zones and Buyer Presence
🌍 ICPUSDT.P: Massive Upside Potential | Check the Trade Update For Seeing Results
🟠 IDEXUSDT: Spot Buy Area | %26 Profit if You Trade with MSB
📌 USUALUSDT: Buyers Are Active + %70 Profit in Total
🌟 FORTHUSDT: Sniper Entry +%26 Reaction
🐳 QKCUSDT: Sniper Entry +%57 Reaction
📊 BTC.D: Retest of Key Area Highly Likely
📊 XNOUSDT %80 Reaction with a Simple Blue Box!
📊 BELUSDT Amazing %120 Reaction!
I stopped adding to the list because it's kinda tiring to add 5-10 charts in every move but you can check my profile and see that it goes on..

#SXP/USDT#SXP
The price is moving in a descending channel on the 1-hour frame and is expected to continue upwards
We have a trend to stabilize above the moving average 100 again
We have a descending trend on the RSI indicator that supports the rise by breaking it upwards
We have a support area at the lower limit of the channel at a price of 0.1970
Entry price 0.2094
First target 0.2147
Second target 0.2234
Third target 0.2320

#SXP/USDT#SXP
The price is moving in a descending channel on the 1-hour frame and is adhering to it well and is heading to break it strongly upwards and retest it
We have a bounce from the lower limit of the descending channel, this support is at a price of 0.2050
We have a downtrend on the RSI indicator that is about to break and retest, which supports the rise
We have a trend to stabilize above the moving average 100
Entry price 0.2087
First target 0.2167
Second target 0.2247
Third target 0.2350

SXPUSDT 1WSXP ~ 1W Analysis
#SXP Buy gradually from here with a short -term target of at least 20%+
The reason, this is the lowest support for now.

SXPUSDT 1WSXP ~ 1W Analysis
#SXP This is the lowest support for now. buy gradually from here with a minimum target of 20%+

#SXP/USDT#SXP
The price is moving in a descending channel on the 1-hour frame and is expected to continue upwards
We have a trend to stabilize above the moving average 100 again
We have a descending trend on the RSI indicator that supports the rise by breaking it upwards
We have a support area at the lower limit of the channel at a price of 0.2870
Entry price 0.2913
First target 0.2984
Second target 0.3100
Third target 0.3213

$SXP in Uptrend chTSX:SXP in uptrend ch and also at 200EMA
it could be near mid of ch or upper
Any way , pay attention at

SXP Breakdown with Potential for Further DeclineIn the midst of a hefty bear market, SXP has broken down from a strong diagonal support, dropping 9% below the support level as indicated on the chart. After a brief bounce to retest the broken support, the price is now expected to continue its downward trajectory, potentially losing another 11–20%.
However, caution is advised. If the market shifts unexpectedly and SXP manages to reclaim and hold the support, this bearish scenario would be invalidated, opening the door for an upward run.
Stay alert and monitor the current price action closely.
Follow for more trade ideas and updates.
NFA: This is not financial advice—always conduct your own research and manage your risk wisely.

$SXP massive cup & handle patternThere is a massive cup and handle pattern forming on the weekly. Once we break $0.39 on strong volumes we could be set for a run towards $1.

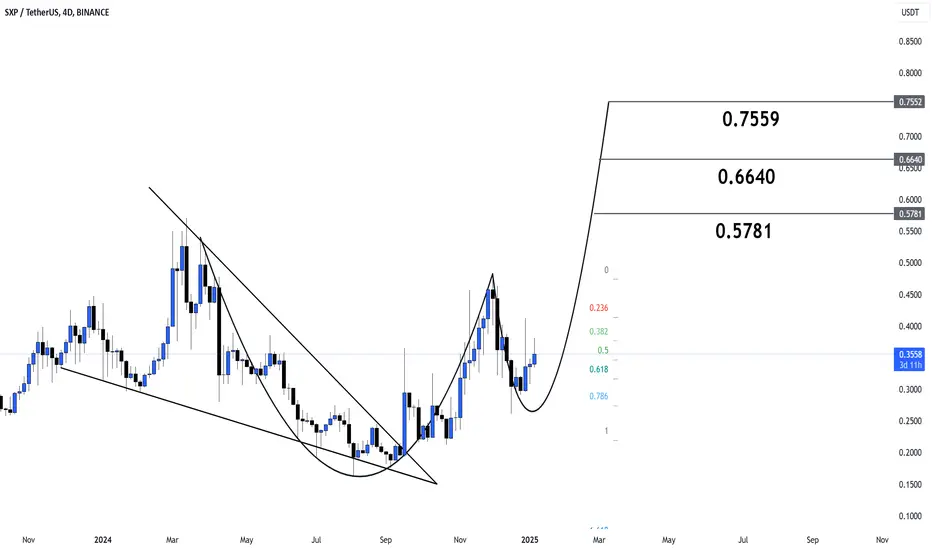
SXP is shaping up for a bullish breakout!
#SXPUSDT has formed a textbook cup-and-handle pattern and is approaching key Fibonacci levels 👀
Targets are set at $0.5781, $0.6640, and $0.7559, signaling significant upside potential 🎯
In my opinion, this setup looks strong, and TSX:SXP could gain momentum for a powerful rally soon 🚀
SXPUSDT Analysis: Believe Me, It’s BigFolks, the blue boxes here? They’re incredible, just incredible. These are the kind of demand zones you dream about. Let me tell you, when we go below the green line , I’ll be ready. It’s all about patience and timing. Nobody knows this better than me.
Here’s What You Need to Know:
Blue Boxes: The best zones, carefully picked. Only winners here.
Trigger Point: Below the green line is where the action starts.
Top Tools: I’ll use CDV, liquidity heatmaps, volume profiles, and volume footprints. The best tools, the greatest strategies, total precision.
Want to Learn From the Best? Look, I can teach you how to use CDV, liquidity heatmaps, volume profiles, and volume footprints . Just DM me. You’ll be learning from someone who knows how to win, believe me.
Remember This: Big trades come from big levels. Don’t rush, wait for the best opportunities. Only the best, folks.
If this helped you, boost it, comment on it, share it far and wide. Let’s make trading great again together!
Let me tell you, folks, this is amazing. Nobody does analysis like I do. Believe me. If this helps you, don't forget to boost and comment! It’s a big deal, motivates me to share even more winning insights with you. Tremendous insights.
I keep my charts the best—clean, simple, and clear. You know it, I know it, clarity leads to better decisions. No question about it. My approach? Built on years of tremendous experience. Incredible track record. I don’t claim to know it all, but I spot high-probability setups like nobody else. Trust me.
Want to learn how to use the heatmap, cumulative volume delta, and volume footprint techniques I use to determine demand regions with stunning accuracy? Send me a private message—totally free, folks. That’s right. I help anyone who wants it, absolutely no charge. Unbelievable value.
Here’s the list—long list, great list—of some of my previous incredible analyses. Each one, a winner:
🎯 ZENUSDT.P: Patience & Profitability | %230 Reaction from the Sniper Entry
🐶 DOGEUSDT.P: Next Move
🎨 RENDERUSDT.P: Opportunity of the Month
💎 ETHUSDT.P: Where to Retrace
🟢 BNBUSDT.P: Potential Surge
📊 BTC Dominance: Reaction Zone
🌊 WAVESUSDT.P: Demand Zone Potential
🟣 UNIUSDT.P: Long-Term Trade
🔵 XRPUSDT.P: Entry Zones
🔗 LINKUSDT.P: Follow The River
📈 BTCUSDT.P: Two Key Demand Zones
🟩 POLUSDT: Bullish Momentum
🌟 PENDLEUSDT.P: Where Opportunity Meets Precision
🔥 BTCUSDT.P: Liquidation of Highly Leveraged Longs
🌊 SOLUSDT.P: SOL's Dip - Your Opportunity
🐸 1000PEPEUSDT.P: Prime Bounce Zone Unlocked
🚀 ETHUSDT.P: Set to Explode - Don't Miss This Game Changer
🤖 IQUSDT: Smart Plan
⚡️ PONDUSDT: A Trade Not Taken Is Better Than a Losing One
💼 STMXUSDT: 2 Buying Areas
🐢 TURBOUSDT: Buy Zones and Buyer Presence
🌍 ICPUSDT.P: Massive Upside Potential | Check the Trade Update For Seeing Results
🟠 IDEXUSDT: Spot Buy Area | %26 Profit if You Trade with MSB
📌 USUALUSDT: Buyers Are Active + %70 Profit in Total
🌟 FORTHUSDT: Sniper Entry +%26 Reaction
🐳 QKCUSDT: Sniper Entry +%57 Reaction
📊 BTC.D: Retest of Key Area Highly Likely
And that’s just the start. The list goes on and on, folks. It’s a tremendous list, the best. I stopped adding because, frankly, it’s tiring. So many wins. People are amazed. You can check my profile and see for yourself—winning moves, all the time. Believe me, nobody does it better.

SXPUSDT 1W#SXP has broken the weekly trendline, and the retest is complete. It is currently facing resistance from the Ichimoku cloud, but more upside movement is expected.
Targets are:
🎯 $0.4596
🎯 $0.5513
🎯 $0.6430
🎯 $0.7736
🎯 $0.9400

SXPUSDT (SolarNetwork) Updated till 30-12-24SXPUSDT (SolarNetwork) Daily timeframe range. PA got long way to go. this is a high risk and reward alt you can see that on binance. for now its trying to reach 0.4694. not much of hold up here if retail interest keeps up. recent support at 0.2941.

SXPUSDT 1WSXP ~ 1W
#SXP Retesting this support block,. If you still have Conviction on this coin,. This support block would be a very good buying place for now.

sxpusdtsxp broke the resistance zone on its 4-hour chart. With the volume that will enter the market, the first target zone is 17% and the second target zone is 50% profit.

SXP - Take Off!!!Dear my friends,
It's time to board the SXP train again. The downtrend has been broken, with a series of green candles on the weekly chart. The target is to break the $1 USDT zone, and from there, we’ll go far together! The RSI is entering the overbought zone with a stable upward trend on the weekly timeframe. Here’s another coin with a robust decentralized finance platform integrated with.
Best Regards!

Solar (sxp)Sxp usdt analysis
Time frame 4 hours
Risk rewards ratio >1.3 👈
Target 0.49$
Qnt has good strong support that doesn't let price to come down ( you can see in this chart . (Dark blue box))


#SXP/USDT#SXP
The price is moving in a descending channel on the 1-hour frame and sticking to it well
We have a bounce from the lower limit of the descending channel, this support is at 0.2236
We have a downtrend, the RSI indicator is about to break, which supports the rise
We have a trend to stabilize above the moving average 100
Entry price 0.2433
First target 0.2848
Second target 0.3120
Third target 0.3400

1.8 RRNot the best trade in the world in my opinion, however the ranges seem strong enough to cause a bounce, with the risk defined as indicated on the chart.

Sxpusdt Buy opportunitySXPUSDT is showing signs of a potential falling wedge formation, with price breaking above the setup near the $0.3 level to reach a temporary high around $0.6. Following this, the price has begun a pullback, retesting the trendline of the falling wedge. The current bounce indicates a reaction at a major support level, presenting a favorable accumulation opportunity. The suggested accumulation zone, along with target levels, is marked on the chart.
Let us know your thoughts on this analysis.

SXPUSDT.P / LONG / M15SXPUSDT.P may rise from the Bullish Order Block 🔥📈
Bullish Order Block: 0.2409 and 0.2380
SXPUSDT is showing potential for an upward move from the bullish order block. Using SMC analysis, there’s a strong chance this trade could end in profits. Let’s watch how the price responds here! 🚀
SXPUSDT.P / LONG / M15
Leverage :- 20X
Entry Price :- 0.2394
Take Profit :- 0.2442
Stop Loss :- 0.2346
