SYSCOIN - SYSMIL:SYS Syscoin
New Years is 5/5 a trend pivot.
4/4 as low pivot, the target was at least the blue bar printed.
Unless the main market makers($) are abandoning the project, and I doubt it because Github activity(devs) is good, then it looks pretty bullish to me.
Many "dino coins" rallied, so th
Related coins

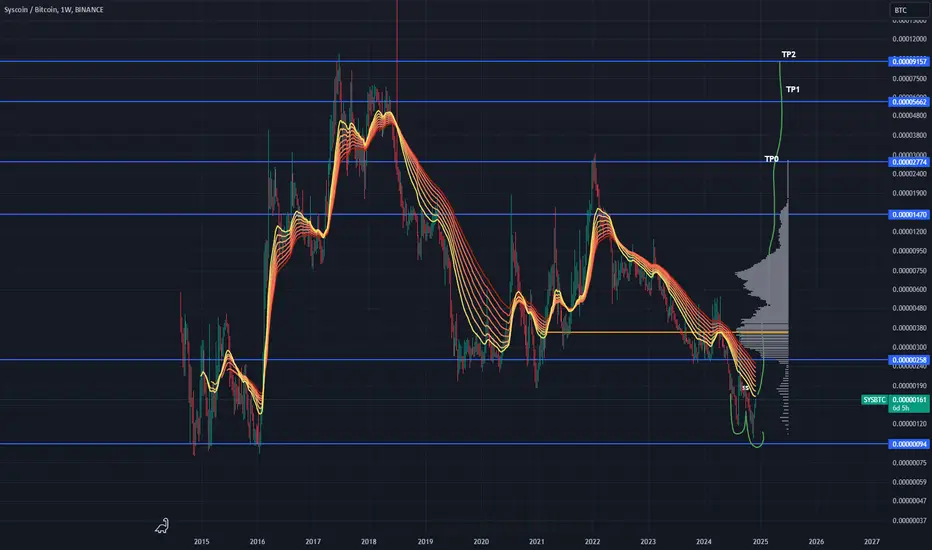
SYS BTC key levels to watch during upward movementSYS has reached the lowest levels against BTC since late 2015, a 9-year minimum (deviation). If it successfully reenters a range of 250-350 sats, the marked levels are key levels to watch and take profit.
Top target 8000 sats.
Not financial advice.
Trading Signal for SYSBTC PairAttention traders! Below is a trading signal for the SYSBTC pair derived using the EASY Quantum AI strategy, which utilizes a combination of market analysis and predictive algorithms.
Direction: Sell
Enter Price: 1.7E-06
Take Profit: 1.67E-06
Stop Loss: 1.76E-06
Our analysis sugges

Can Syscoin Grow ~1,500% Soon? See Inside!Some time ago, between 2016 and 2018, Syscoin, in its SYSBTC trading pair, grew by an astonishing ~26,000%. This can be easily confirmed by looking at the left side of this chart.
After a major bear-market, multiple bottom and reversals signals, as well as Syscoin hitting its lowest price in more

✳️ Syscoin Long-Term Support Range Activated (515% - 1155%)Thinking of the Cryptocurrency market four years cycle, based on Bitcoin's halving, 2019 is analogous to 2023. 2020 is analogous to 2024.
Syscoin (SYSBTC) is now moving within a higher low of a very strong support range that was active back in 2019 and 2020 before a major 1,500%+ bullish wave. This

Syscoin (SYS) formed a bullish Cypher for upto 22% pumpHi dear friends, hope you are well and welcome to the new trade setup of Syscoin (SYS) with Bitcoin pair.
Our last successful trade of SYS was as below:
Now on a daily time frame, SYS with Bitcoin pair has formed a bullish Cypher move for another price reversal.
Note: Above idea is for educ

✳️ Syscoin Starts To Recover | End Of CorrectionFollowing in the footsteps of OMGBTC, SYSBTC now starts to recover.
This is really good news because it signals that the Altcoins vs Bitcoin (ALTSBTC) pairs are ready to move ahead.
Notice that this one produced a higher low vs January.
Some will produce higher lows while others will produce low

SYS/BTC - Syscoin: Resistance_Breakout◳◱ A Resistance Breakout has been identified on the $SYS / $BTC chart. The price has broken above a key resistance level, indicating a potential bullish trend. The next resistance key levels are located at 0.00000682 | 0.00000766 | 0.00000894, and the major support zones can be found at 0.00000554 |

Syscoin (SYS) forming bullish a Gartley for upto 49% rallyHi dear friends, hope you are well and welcome to the new trade setup of Syscoin ( SYS ).
Previously we caught more than 50% pump of SYS as below:
Now on a 4-hr time frame, SYS is about to complete the final leg of a bullish Gartley move.
Note: Above idea is for educational purpose only. It

$SYS/#BTC [#Syscoin]: ResistanceBreakoutWe've identified a Resistance Breakout on the $SYS/$BTC chart. The price has broken above a key resistance level, which can indicate a potential bullish trend. Taking in consideration the next resistance key levels are at 0.0000076 | 0.00000832 | 0.00000985 and the major support zones are respectiv

See all ideas
Summarizing what the indicators are suggesting.
Oscillators
Neutral
SellBuy
Strong sellStrong buy
Strong sellSellNeutralBuyStrong buy
Oscillators
Neutral
SellBuy
Strong sellStrong buy
Strong sellSellNeutralBuyStrong buy
Summary
Neutral
SellBuy
Strong sellStrong buy
Strong sellSellNeutralBuyStrong buy
Summary
Neutral
SellBuy
Strong sellStrong buy
Strong sellSellNeutralBuyStrong buy
Summary
Neutral
SellBuy
Strong sellStrong buy
Strong sellSellNeutralBuyStrong buy
Moving Averages
Neutral
SellBuy
Strong sellStrong buy
Strong sellSellNeutralBuyStrong buy
Moving Averages
Neutral
SellBuy
Strong sellStrong buy
Strong sellSellNeutralBuyStrong buy
Displays a symbol's price movements over previous years to identify recurring trends.