SYS (SPOT)BINANCE:SYSUSDT
#SYS/ USDT
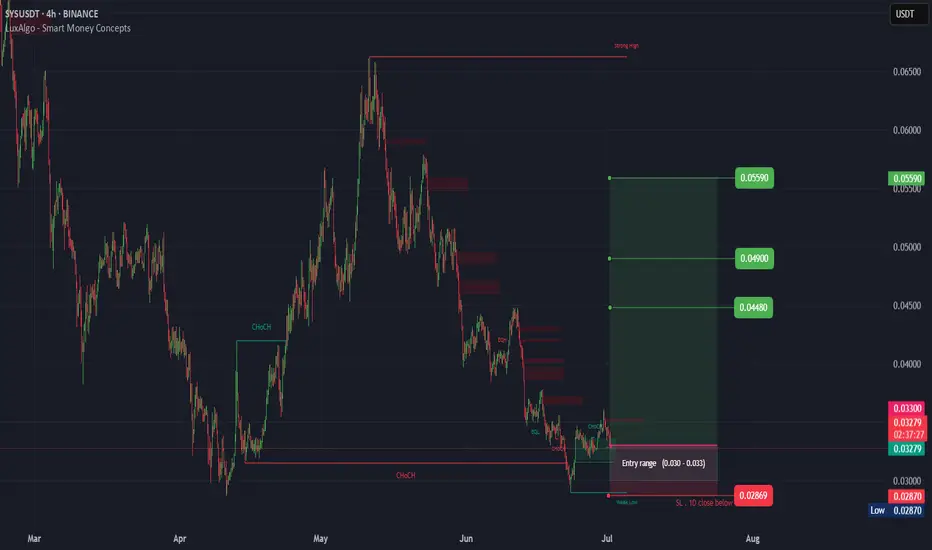
Entry( 0.030- 0.033)
SL 1D close below 0.02869
T1 0.04480
T2 0.04900
T3 0.05900
_______________________________________________________
Golden Advices.
********************
* collect the coin slowly in the entry range.
* Please calculate your losses before the entry.
Related pairs
Syscoin: From Bearish to Bullish, The Market Wants ChangeChange is good, but it is not always mandatory. Change is good and recommended only when we are stuck in a certain pattern, in a certain routine or lifestyle, in a certain way of being and we want to experience growth. Exponential growth. When it comes to growth, change is awesome.
Market condition

SYSUSDT | Still Weak, Resistance Holds at the Red BoxSYSUSDT continues to show fragile price action. Until the red‑boxed area is cleared with genuine volume support, every upward move remains suspect. Here’s how I’d approach it:
Expect Rejections at Resistance
The red box marks a zone where sellers have stepped in repeatedly. Unless SYS clears this l

#SYS/USDT#SYS
The price is moving within a descending channel on the 1-hour frame and is expected to break and continue upward.
We have a trend to stabilize above the 100 moving average once again.
We have a downtrend on the RSI indicator, which supports the upward move by breaking it upward.
We have a s

#SYS/USDT#SYS
The price is moving in a descending channel on the 1-hour frame and is adhering to it well and is heading to break it strongly upwards and retest it
We have a bounce from the lower limit of the descending channel, this support is at a price of 0.0474
We have a downtrend on the RSI indicator

SYS looks very bullish (1D)It seems that a diametric pattern has completed, and the price has reclaimed a key level. A pullback to this level is expected to hold as support, potentially leading the price toward higher zones.
The targets are marked on the chart, and as long as the green zone is maintained, a move toward those

SYSUSDT 1DThe price has approached the dynamic descending trendline while entering the Potential Reversal Zone (PRZ) of the Butterfly harmonic pattern. Given the confluence of technical factors and within the designated time frame marked on the chart, the conditions appear favorable for a potential bullish re

SYSSYS is a good trade for now please take the stoploss in consideration because the market is not stable

#SYS/USDT#SYS
The price is moving in a descending channel on the 1-hour frame and is adhering to it well and is heading to break it strongly upwards
We have a bounce from the lower limit of the descending channel, this support is at a price of 0.0583
We have a downtrend on the RSI indicator that is about

SYSUSDT Quick Scalp IdeaBINANCE:SYSUSDT Entry Now
SL: 4Hr close below 0.0952
Targets:
🎯 0.1002
🎯 0.1021
🎯 0.1044
Small risk.
Reason: 1 hour timeframe pullback.
Not financial advice, just a quick idea

See all ideas
Summarizing what the indicators are suggesting.
Oscillators
Neutral
SellBuy
Strong sellStrong buy
Strong sellSellNeutralBuyStrong buy
Oscillators
Neutral
SellBuy
Strong sellStrong buy
Strong sellSellNeutralBuyStrong buy
Summary
Neutral
SellBuy
Strong sellStrong buy
Strong sellSellNeutralBuyStrong buy
Summary
Neutral
SellBuy
Strong sellStrong buy
Strong sellSellNeutralBuyStrong buy
Summary
Neutral
SellBuy
Strong sellStrong buy
Strong sellSellNeutralBuyStrong buy
Moving Averages
Neutral
SellBuy
Strong sellStrong buy
Strong sellSellNeutralBuyStrong buy
Moving Averages
Neutral
SellBuy
Strong sellStrong buy
Strong sellSellNeutralBuyStrong buy
Displays a symbol's price movements over previous years to identify recurring trends.
Frequently Asked Questions
The current price of Syscoin / TetherUS (SYS) is 0.04079 USDT — it has risen 1.99% in the past 24 hours. Try placing this info into the context by checking out what coins are also gaining and losing at the moment and seeing SYS price chart.
Syscoin / TetherUS price has fallen by −16.34% over the last week, its month performance shows a 14.69% increase, and as for the last year, Syscoin / TetherUS has decreased by −51.21%. See more dynamics on SYS price chart.
Keep track of coins' changes with our Crypto Coins Heatmap.
Keep track of coins' changes with our Crypto Coins Heatmap.
Syscoin / TetherUS (SYS) reached its highest price on Jan 2, 2022 — it amounted to 1.33000 USDT. Find more insights on the SYS price chart.
See the list of crypto gainers and choose what best fits your strategy.
See the list of crypto gainers and choose what best fits your strategy.
Syscoin / TetherUS (SYS) reached the lowest price of 0.02870 USDT on Apr 10, 2025. View more Syscoin / TetherUS dynamics on the price chart.
See the list of crypto losers to find unexpected opportunities.
See the list of crypto losers to find unexpected opportunities.
The safest choice when buying SYS is to go to a well-known crypto exchange. Some of the popular names are Binance, Coinbase, Kraken. But you'll have to find a reliable broker and create an account first. You can trade SYS right from TradingView charts — just choose a broker and connect to your account.
Crypto markets are famous for their volatility, so one should study all the available stats before adding crypto assets to their portfolio. Very often it's technical analysis that comes in handy. We prepared technical ratings for Syscoin / TetherUS (SYS): today its technical analysis shows the sell signal, and according to the 1 week rating SYS shows the sell signal. And you'd better dig deeper and study 1 month rating too — it's sell. Find inspiration in Syscoin / TetherUS trading ideas and keep track of what's moving crypto markets with our crypto news feed.
Syscoin / TetherUS (SYS) is just as reliable as any other crypto asset — this corner of the world market is highly volatile. Today, for instance, Syscoin / TetherUS is estimated as 4.39% volatile. The only thing it means is that you must prepare and examine all available information before making a decision. And if you're not sure about Syscoin / TetherUS, you can find more inspiration in our curated watchlists.
You can discuss Syscoin / TetherUS (SYS) with other users in our public chats, Minds or in the comments to Ideas.