Wall Street Very Expensive: Time for Europe and China?1) The S&P 500 valuation has reached its late 2021 record
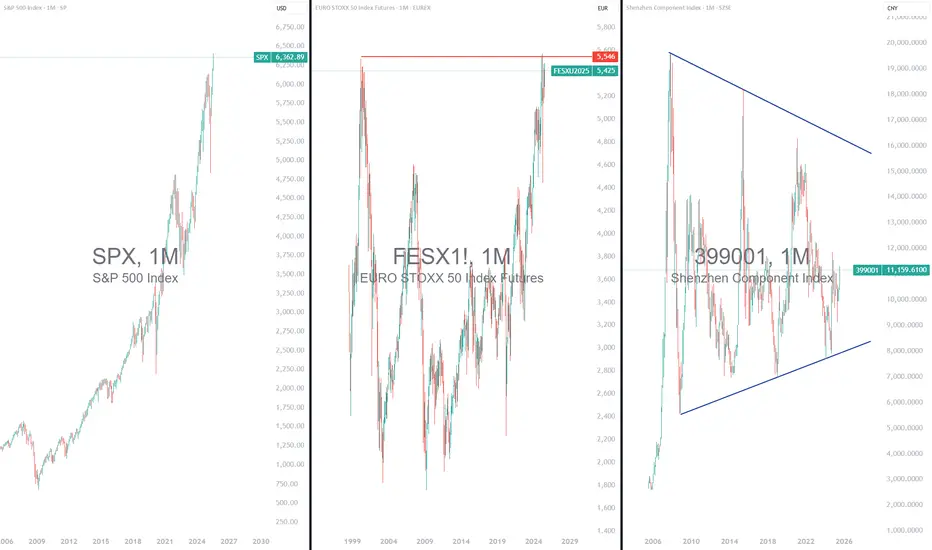
In the second quarter of 2025, the valuation of the U.S. market, represented by the S&P 500, returned to its record levels of late 2021. The S&P 500 has been reaching new all-time highs consistently since early July. In contrast, European and Chinese markets appear undervalued. In Europe, indices such as the Stoxx 600 and the Eurostoxx 50 remain below their historical highs. There is catch-up potential, especially as valuation remains reasonable. Technically, these markets offer attractive setups. In China, the potential is even more pronounced. Chinese markets are significantly behind, both technically and fundamentally. It would simply be a matter of returning to their former peaks.
Although U.S. corporate earnings remain strong, the current valuation of the S&P 500 limits its short-term upside potential. Conversely, Europe—and especially China—offers a more attractive risk/reward profile at this point in the cycle, both in terms of market valuation and technical analysis. While the S&P 500’s long-term trend remains bullish, it may therefore be wise to rebalance slightly in favor of European and Chinese equities.
The first chart below shows monthly candlesticks for the flagship Shenzhen stock exchange index.
The second chart below shows monthly candlesticks for the EuroStoxx 50 futures contract, with a market that has not yet exceeded its historical high—unlike the S&P 500 index.
2) The Shiller PE (or CAPE Ratio) is the best option to compare U.S., European and Chinese equity market valuations
The CAPE ratio (Cyclically Adjusted Price-to-Earnings ratio), also called the Shiller PE, is a financial indicator that measures stock market valuation. It compares the current price of an index, such as the S&P 500, to average inflation-adjusted earnings over the past ten years. Unlike the standard PE ratio based on a single year’s earnings, the CAPE smooths out cyclical fluctuations to provide a more stable, long-term view of valuation.
While the Shiller PE of the S&P 500 has returned to its 2021 record, that of the European and especially Chinese equity markets remains well behind. There is therefore still significant catch-up potential for Chinese and European stocks compared to U.S. stocks according to this fundamental valuation metric.
The chart below, produced by Barclays Research, shows a comparison of equity market valuations using the CAPE ratio between China, the United States, and Europe.
The Warren Buffett indicator, for its part, proposes a valuation comparison using the ratio of market capitalization to GDP. Here too, the message is clear: the Chinese equity market is significantly cheaper than the U.S. equity market. The table below is taken from the website Gurufocus.
DISCLAIMER:
This content is intended for individuals who are familiar with financial markets and instruments and is for information purposes only. The presented idea (including market commentary, market data and observations) is not a work product of any research department of Swissquote or its affiliates. This material is intended to highlight market action and does not constitute investment, legal or tax advice. If you are a retail investor or lack experience in trading complex financial products, it is advisable to seek professional advice from licensed advisor before making any financial decisions.
This content is not intended to manipulate the market or encourage any specific financial behavior.
Swissquote makes no representation or warranty as to the quality, completeness, accuracy, comprehensiveness or non-infringement of such content. The views expressed are those of the consultant and are provided for educational purposes only. Any information provided relating to a product or market should not be construed as recommending an investment strategy or transaction. Past performance is not a guarantee of future results.
Swissquote and its employees and representatives shall in no event be held liable for any damages or losses arising directly or indirectly from decisions made on the basis of this content.
The use of any third-party brands or trademarks is for information only and does not imply endorsement by Swissquote, or that the trademark owner has authorised Swissquote to promote its products or services.
Swissquote is the marketing brand for the activities of Swissquote Bank Ltd (Switzerland) regulated by FINMA, Swissquote Capital Markets Limited regulated by CySEC (Cyprus), Swissquote Bank Europe SA (Luxembourg) regulated by the CSSF, Swissquote Ltd (UK) regulated by the FCA, Swissquote Financial Services (Malta) Ltd regulated by the Malta Financial Services Authority, Swissquote MEA Ltd. (UAE) regulated by the Dubai Financial Services Authority, Swissquote Pte Ltd (Singapore) regulated by the Monetary Authority of Singapore, Swissquote Asia Limited (Hong Kong) licensed by the Hong Kong Securities and Futures Commission (SFC) and Swissquote South Africa (Pty) Ltd supervised by the FSCA.
Products and services of Swissquote are only intended for those permitted to receive them under local law.
All investments carry a degree of risk. The risk of loss in trading or holding financial instruments can be substantial. The value of financial instruments, including but not limited to stocks, bonds, cryptocurrencies, and other assets, can fluctuate both upwards and downwards. There is a significant risk of financial loss when buying, selling, holding, staking, or investing in these instruments. SQBE makes no recommendations regarding any specific investment, transaction, or the use of any particular investment strategy.
CFDs are complex instruments and come with a high risk of losing money rapidly due to leverage. The vast majority of retail client accounts suffer capital losses when trading in CFDs. You should consider whether you understand how CFDs work and whether you can afford to take the high risk of losing your money.
Digital Assets are unregulated in most countries and consumer protection rules may not apply. As highly volatile speculative investments, Digital Assets are not suitable for investors without a high-risk tolerance. Make sure you understand each Digital Asset before you trade.
Cryptocurrencies are not considered legal tender in some jurisdictions and are subject to regulatory uncertainties.
The use of Internet-based systems can involve high risks, including, but not limited to, fraud, cyber-attacks, network and communication failures, as well as identity theft and phishing attacks related to crypto-assets.
399001 trade ideas
Chinese equities: the potential for catching up is attractiveIntroduction: While the US equity market has rallied vertically since the beginning of April on the back of trade diplomacy, the S&P 500 is now not far from its all-time high and is once again expensive in terms of market valuation. From a diversification point of view, the Chinese equity market may appear to offer some advantages at present, both technically and fundamentally. In fact, it is nowhere near its all-time high, unlike the MSCI World stock market index, which has just reached its all-time high and could do with some breathing space in the short term.
The chart below shows the monthly Japanese candlesticks of the MSCI World stock market index.
1) The Chinese equity market is significantly cheaper than Wall Street in terms of valuation
With the upward rally in US equities since the beginning of April, the S&P 500 is close to regaining its January valuation level, which is high by historical standards.
Two valuation barometers are examined here: the Shiller PE and the Warren Buffet Indicator, the latter being the ratio of total market capitalization to GDP.
The first table below shows a column with the market capitalization/GDP ratio for the world's main stock markets. While Wall Street's market capitalization represents almost 200% of US GDP (a speculative bubble according to the Buffet indicator), this ratio is only 66% for the Chinese equity market, an equity market considered cheap according to this valuation statistic.
The following chart compares the PE Shiller of the S&P 500 with the PE Shiller of the CSI 300, the Shanghai Stock Exchange's flagship index. According to this valuation ratio, which is highly respected by the world's top financial institutions, the Chinese equity market is more than half as expensive as the US equity market.
2) China's monetary and fiscal policies are highly accommodating, providing support for the equity market.
In addition to attractive stock market valuations, the Chinese equity market is benefiting from the Central Bank of China's highly accommodating monetary policy, as well as a fiscal policy designed to stimulate the economy, investment and household consumption.
Ultimately, this translates into a marked upward trend in the money supply in China, a combination of fundamental factors that are acting in support of the Chinese equity market.
To illustrate this, below are charts showing the BPoC's regular rate cuts, as well as the upward trend in Chinese liquidity and public debt to support China's economic growth.
3) In terms of technical analysis, the potential for a bullish recovery is still strong on China's main stock indices
To conclude this new market view on TradingView (please subscribe to our account to be alerted in real time to our new market analyses), here are three graphical representations of the flagship stock indices of the Shenzhen and Shanghai stock exchanges.
For both stock indices, the market has rebounded in recent months from major historical support levels, and major resistance levels are still well above the current price level.
This market analysis would be called into question in the event of a breach of the major technical supports shown on the charts below.
DISCLAIMER:
This content is intended for individuals who are familiar with financial markets and instruments and is for information purposes only. The presented idea (including market commentary, market data and observations) is not a work product of any research department of Swissquote or its affiliates. This material is intended to highlight market action and does not constitute investment, legal or tax advice. If you are a retail investor or lack experience in trading complex financial products, it is advisable to seek professional advice from licensed advisor before making any financial decisions.
This content is not intended to manipulate the market or encourage any specific financial behavior.
Swissquote makes no representation or warranty as to the quality, completeness, accuracy, comprehensiveness or non-infringement of such content. The views expressed are those of the consultant and are provided for educational purposes only. Any information provided relating to a product or market should not be construed as recommending an investment strategy or transaction. Past performance is not a guarantee of future results.
Swissquote and its employees and representatives shall in no event be held liable for any damages or losses arising directly or indirectly from decisions made on the basis of this content.
The use of any third-party brands or trademarks is for information only and does not imply endorsement by Swissquote, or that the trademark owner has authorised Swissquote to promote its products or services.
Swissquote is the marketing brand for the activities of Swissquote Bank Ltd (Switzerland) regulated by FINMA, Swissquote Capital Markets Limited regulated by CySEC (Cyprus), Swissquote Bank Europe SA (Luxembourg) regulated by the CSSF, Swissquote Ltd (UK) regulated by the FCA, Swissquote Financial Services (Malta) Ltd regulated by the Malta Financial Services Authority, Swissquote MEA Ltd. (UAE) regulated by the Dubai Financial Services Authority, Swissquote Pte Ltd (Singapore) regulated by the Monetary Authority of Singapore, Swissquote Asia Limited (Hong Kong) licensed by the Hong Kong Securities and Futures Commission (SFC) and Swissquote South Africa (Pty) Ltd supervised by the FSCA.
Products and services of Swissquote are only intended for those permitted to receive them under local law.
All investments carry a degree of risk. The risk of loss in trading or holding financial instruments can be substantial. The value of financial instruments, including but not limited to stocks, bonds, cryptocurrencies, and other assets, can fluctuate both upwards and downwards. There is a significant risk of financial loss when buying, selling, holding, staking, or investing in these instruments. SQBE makes no recommendations regarding any specific investment, transaction, or the use of any particular investment strategy.
CFDs are complex instruments and come with a high risk of losing money rapidly due to leverage. The vast majority of retail client accounts suffer capital losses when trading in CFDs. You should consider whether you understand how CFDs work and whether you can afford to take the high risk of losing your money.
Digital Assets are unregulated in most countries and consumer protection rules may not apply. As highly volatile speculative investments, Digital Assets are not suitable for investors without a high-risk tolerance. Make sure you understand each Digital Asset before you trade.
Cryptocurrencies are not considered legal tender in some jurisdictions and are subject to regulatory uncertainties.
The use of Internet-based systems can involve high risks, including, but not limited to, fraud, cyber-attacks, network and communication failures, as well as identity theft and phishing attacks related to crypto-assets.

Bullish FlagDaily chart is forming Flag Pennant, which is high possibility of the bullish trend after breaching out the upper line.

More Drops for Shenzhen Component 399001Multiple trendline breaks, confirming further downward action. Fibonacci goals not quite met, but there is still time. Divergences not present yet.
We are not in the business of getting every prediction right, no one ever does and that is not the aim of the game. The Fibonacci targets are highlighted in green or purple with invalidation in red. Confirmation level, where relevant, is a pink dotted, finite line. Fibonacci goals, it is prudent to suggest, are nothing more than mere fractally evident and therefore statistically likely levels that the market will go to. Having said that, the market will always do what it wants and always has a mind of its own. Therefore, none of this is financial advice, so do your own research and rely only on your own analysis. Trading is a true one man sport. Good luck out there and stay safe.

The SZSE Component Index 6/5/22The SZSE Component Index is an index of 500 stocks that are traded at the Shenzhen Stock Exchange (SZSE). It is the main stock market index of SZSE.
Price reached Fib ( 0.618 )
Price reached Weekly FVG
Good opportunity of long position.
+41.5% if price reached first red line
Good Luck Trader💯💯
.
.
.
.
.
.
🧅Disclaimer :There are risks associated with investing in securities. Investing in stocks, bonds, exchange traded funds, mutual funds, and money market funds involve risk of loss. Loss of principal is possible. Some high risk investments may use leverage, which will accentuate gains & losses. Foreign investing involves special risks, including a greater volatility and political, economic and currency risks and differences in accounting methods. This is Not Financial Advice
🧅JUST AN OPINION OF THE ONION.🧅


ShenZhen Component Index ended its 3 months retracement. Bullish
ShenZhen Component Index 3 months retracement ended.
Sideways retracement for 3 months without lower lows created.
Bullish months ahead.


399001: SZSE COMPONENT INDEXSZSE COMPONENT INDEX
1 - 15827
2 - 17648
3 - 19332
Stop, fixing below 11652
✅ f you like what I do, put 👍 and subscribe
Waiting for your comment, what do you think about this?

Shenzhen Component Index Holding Up WellShenzhen Component Index
- Remains solid holding up above its Mid term Trend Support.
- A breakout from its sideways resistant will bring the index to go for Super Bull Run.
- Downside risk remain easily at its Mid Term Trend Support. A violation will serve as 1st warning.
- Long Term Trend Support (Red Line) will be the crucial support in the long run. A violation will mean the index is heading into a Bear Market.


Overall Long on ShenzhenShort-term short, but overall I'm still positive on this index. That said, this can turn ugly very, very, very quickly as the Shenzhen is the most speculative index in Asia for sure, maybe even the world. Definitely the highest volatility. So, if we do see a short-term pullback, this could quickly be followed by 5 percent gains on the day that the US and China sign a trade war deal which is expected to happen sometime in April. Overall though, I'm net positive. And when that trade war deal comes, that's the day I'll sell because I'm not sure what is driving this Chinese market upwards with follow through given the fact that the Chinese economy is still slowing down which should really put into question why we are seeing such huge gains in their three main indexes.


Expecting Short term rebound1. Back at 2007/2008 Tops
2. At 2015 base formation support zone, broke lower support three times but bears failed to hold.
3. Break of falling wedge and failure to follow through may lead to bullish move.
4. Reached bearish 2.618 fib target.
5. After 6/19 plunge, Markets has been consolidating in tight range and hesitating to decline further - potential signs of bear exhaustion
6. Big end of month bullish candle - bull interest/ bears closing positions
7. RSI bullish divergence - market oversold, bears holding onto positions carry higher risk

China 500 (Shenzhen Composite) could drop to 1100-1200Chinese index could drop to the trendline within the WXY correction.
This area is located at the 1100-1200 level.
The trade war with US is in the background.
Today is the Chinese public holiday (Dragon Boats Festival).
Tomorrow we could see the gap down.
Invalidation above wave E (2047)

cautiously long08-30: cross downwards trend line, buy
first support: 1980
second support: 1955
if go below support, out
if any correction doesn't break support, hold
if go above resistance 2055 before 11-17, very positive towards 2220.


