TARGET FILLED ON 1010A trade I gave to my clients the beginning of this month reached the target last week.
These are the kind of the trades we're taking, slow but profitable!
Join the community by following us!
1010 trade ideas

RIYAD BANK - Weekly Chart (TADAWUL)RIYAD BANK - Weekly Chart (TADAWUL)
Current Price: Around 30.60
Target Price: 42.90 (marked with a heart 💗 at the top)
Plan:
Price may first drop a little (towards 27–28 zone), then move up strongly toward the target (42.90).
Important Zones:
FVG: Areas where price may bounce or react.
OB (Order Block): A strong resistance zone.
Change in Status: A possible support area where the trend might change.
Overall Idea:
The chart shows a possible move down first, then a big upward move toward the 42.90 target.

1010 - Riyad Bank - Tadawul1010 has recently broken above a significant falling trendline on the weekly timeframe, signaling a potential trend reversal, price forming HH & HL on daily timeframe. buy at 28.15 which represents the HH on the weekly chart with the stop loss of 24.9 and Tp1 31.4, Tp2 35.1.

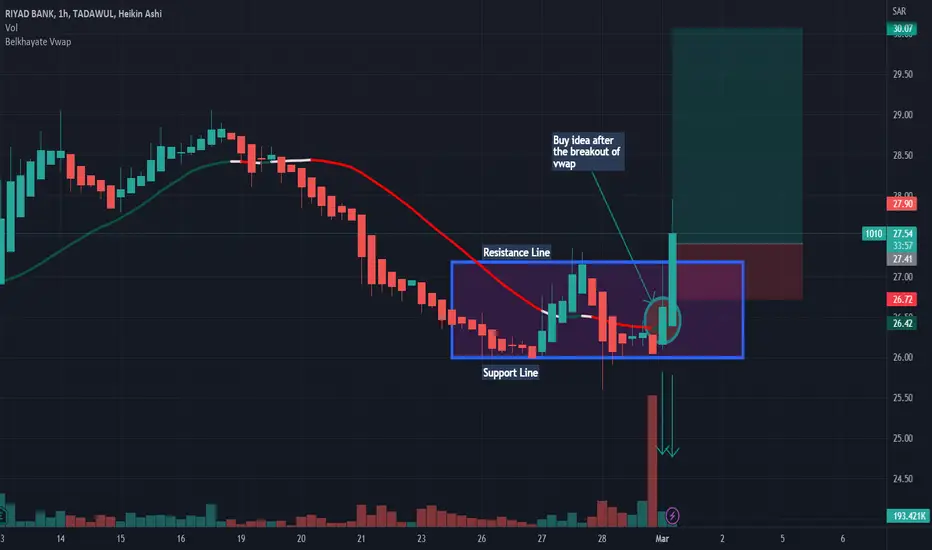
1010: Big probability of an uptrendWe would have a high probability of having an uptrend if and only if the vwap indicator as well as the resistance line are broken forcefully.Thanks!

1010: Buy ideaOn 1010 as you see on the chart we will have a hight probability to have an uptrend if only if we have the breakout with force the vwap and the resistance line by a big green candle follow by a large green volume.! Thanks!


1010: Buy ideaOn 1010 as you see on the chart we will have a big probability to have an uptrend if we have the breakout with force the vwap indicator and the resistance line by a big green candle with a large green volume.Thanks!

1010: Buy ideaOn 1010 we will have a hight probability to have an uptrend if only if we have the breakout with force the vwap indicator and the resistance line by a big green candle follow by a large green volume.Thanks!

1010: Buy ideaOn 1010 as you see on the chart we are in a bearish channel situation so it's mean that after the breakout with force the resistance line and the vwap indicator by a big green candle with a large green volume we will have a hight probability to have an uptrend.Thanks.

1010: Sell ideaSell idea on 1010 as you see on the chart because we have the breakout with force the vwap indicator by a big red candle. Thanks.

1010 RIYADH BANKh4 timeframe price is bullish.
falls becouse takenout trendline liqudity.
only order block at extreme point.
i will enter if in ltf any choch or flip or liqudity sweap entry.

1010 RIYADH BANKEVERY CANDLE HAS LIQUIDITY.
PRICE ALWAYS NEED LIQUIDITY.
Nobody Knows Where is Price Going.
Hey traders, here is the analysi.
If you guys like my analysis please hit like?? and follow.
Thanks.
DISCLAIMER- This is not financial advice.
SMART MONEY CONCEPT.
identify Liquidity Or Become Liquidity


1010: analysisOn 1010 as you see on the chart we will have a big probability to have an uptrend after the breakout with force the vwap and the resistance line by a big green candle with a large green volume.Thanks!

1010: Big probability of downtrendOn 1010 as you see on the chart we have a squeeze so it's mean that we will have a big probability to have a downtrend.Thanks!

1010: Analysis: two situationsAs you see on the chart we have two situations. We will have a big probability to have an uptrend if only if we have the breakout with force the resistance line by a big green candle with a large green volume. In other hand, we will have also a downtrend if only if we have the breakout with force the support line and the vwap indicator by a big red candle with a large red volume.Thanks!

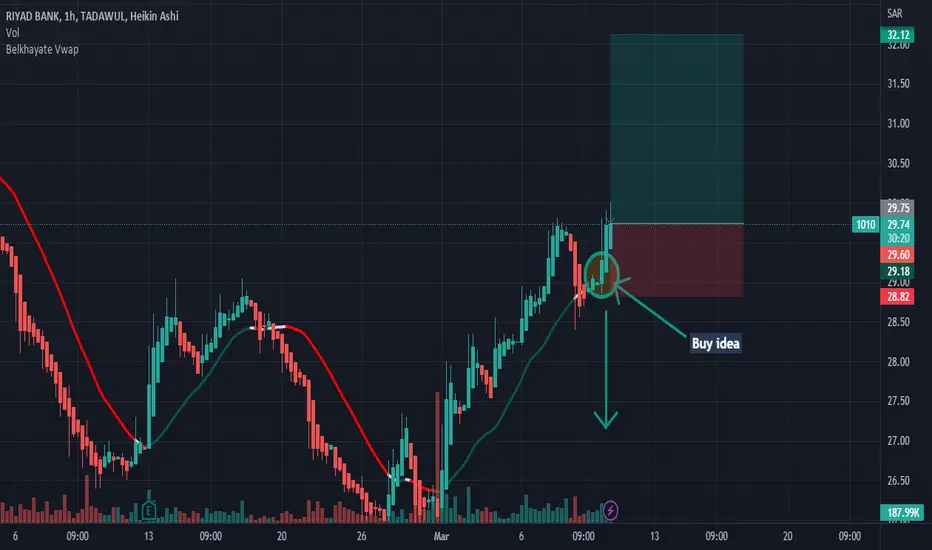
1010: Buy ideaAs you see on the chart we have a buy idea after the breakout of the vwap indicator.Thanks!
1010: Buy ideaAs you see on the chart we have a buy idea because we have the breakkout with force the vwap and the resistance line by a big green candle.Thanks!

1010: Buy ideaAs you see on the chart we have a buy idea because we have the breakout with force the vwap and the resistance line by a big green candle with a large green volume.Thanks!

1010: Sell ideaAs you see on the chart we have a sell idea after the breakout with force the vwap and the support line! Thanks!

Buy ideaGood morning all! We have a buy idea as you see on the chart because we have the breakout with force the vwap indicator by the buyers with a big green candle with a large green volume and we are above the vwap indicator so we will have a good uptrend.Thank so much!

Sell ideaAs you see on the chart we have a sell idea after the breakout with force the support line by a big red candle with a large red volume by the sellers.Thanks!
