EL RAJHI BANKestimated time and price of EL RAJHI BANK
WE THINK THAT 98 is the estimated price of the 3rd week in October 2024
1120 trade ideas

Rajhi Bank (1120) has a bullish potential to 117.4 and moreWeekly chart, the stock formed a bullish chart pattern falling wedge,
the target is 92.8, then 117.4 passing through the shown resistance levels
Technical indicator MACD is positive and crossed its signal above zero line.

DON'T BUY 1120 NOWDear Saudi Traders and Investors,
As you have read on the title, don't buy 1120 this week, you can see on the chart, the price is currently on the tough resistance we have at 83.2, since it has a high volume, we must wait for the price to give us a confirmation that it will continue on its way up. If not this MIGHT be a pullback, however there's a high probability of going higher. To play it safe wait for the confirmation.
Don't hesitate to task in case you got furder questions!

1120The chart pattern shows rejection in price after testing resistance level of 77. MACD is shifting from bullish to bearish. The price can test support level around 71.

1120The Tadawul All Shares Index (TASI) closed the latest weekly session at 11,225.35 , marking a positive gain of 47.87 points (0.43%) . Currently, the index is testing desending trend line. The index shows low activity with a small candle body which indicated rejection can be seen in upcoming sessions. A bearish pattern is evident until the 10,400 support sustains. The weekly RSI stands at 53.84, while the MACD signals a weak bearish trend, poised for a bearish shift.

Strong Sell Signal On AL RAJHI BANK With High Probability!Hello ladies and gentlemen, according to my graphical analysis of AL RAJHI BANK, there is a high probability of a decline towards the 68 SAR level in the next few months!

ANALYSIS ON 1120Dear Saudi Traders and Investors,
I'm sharing with you today analysis on some stocks you can't buy currently since you will end up by losing your money. Buy on the other stocks on which you have an opportunity to buy, before you do make sure to get you a good consultation!
As you can see on the chart, the stock broke the level 0.6 a month ago and now it still going down heading towards the level 0.7. If you're holding the stock in loss close before making more losses, and if you're welling to buy this isn't the good moment to buy.
For further questions, don't hesitate to ask!

ANALYSIS ON 1120Dear Saudi Traders and investors,
Yesterday I posted about a stock you can't buy since it's going down, today I'm sharing with you some of the stocks you can't buy until it gives an entry point.
You can notice on the chart that the price broke the support level we have at 70.5 and now it's heading towards 61.8, for now don't buy, wait for the appropriate entry point or invest on other stocks that will return you with profits.


Technical and digital analysisWe notice that we are in the process of a correction to the upside, and there is an increase in the buying momentum, and we wait for the selling momentum to weaken in the correction, and we buy and there is divergence

AL RAJHI BANK A very golden buying opportunityHi, according to my analysis of Al-Rajhi Bank stock. There is a very good buying opportunity. The stock rebounded from a very strong area, which is the support at the 70 level. It also broke the bearish flag with a very positive green candle. It means a strong entry for buyers. good luck for everbody

ALRAJHI BANK 1120 still in downtrend!1year of correction still going strong..
we might see a pullback to 87 at most than heading to 61.8 which is act as a support.
the main support entry which I recommend to wait for 49-55 levels..
Now, I see a little swing trade with a maximum STOPLOSS at 66 and targeting 80 levels.
if there is a weekly close under 69.1 we might see 61.8 shortly be careful!

Quick analysis on 1120Good afternoon dear Saudi investors, since this week is a holiday, I said why not to share with you some quick analysis on 3 of your local markets.
As you can see here on 1120, the price kept consolidating in a channel for the last 4 months, in this case I told my customers 2 months ago not to buy it until we get a confirmation of the breakout of the channel, lately I recieved too many DMs from people who have bought in a wrong time due to bad consultation asking whether they keep their position or sell. Please before you get in a stock always make sure to have a good consultation and always make sure to buy in a safe zone.
Well, here in this case you must wait for it to break the channel it is consolidating in then you buy.
Let me know if there's any market you want me to analyze for you.

A wonderful idea about this stockwe can enter gain in the area of 70 riyal
a big buyer appeared here inn this area before with high volume , AND he was able to stop the downward volume for some candlesticks.
we think it will retest this area , the buyer will appear again and will shift the trend .
we mus have a stop loss at 68 riyal perstock

Quick analysis on 1120Dear Saudi investors, I'm sharing with you one of the analysis I gave to my clients days ago on 1120.
As you can see the price kept consolidating on a channel for the past year, now as you can see it's about to break the channel, if you're welling to buy don't do it since it's too risky to do now.
I'll be posting it in the future but it will be a week or two delaied since I can't share to public at the same time I give them to my clients.

1120: Buy ideaOn 1120 as you see on the chart we will have a big probability to have an uptrend because we have the breakout with force the vwap indicator and the resistance line.Thanks!

ALRAJHI BANK 1120Nobody Knows Where is Price Going.
Hey traders, here is the analysi.
If you guys like my analysis please hit like?? and follow.
Thanks.
DISCLAIMER- This is not financial advice.
SMART MONEY CONCEPT.
identify Liquidity Or Become Liquidity

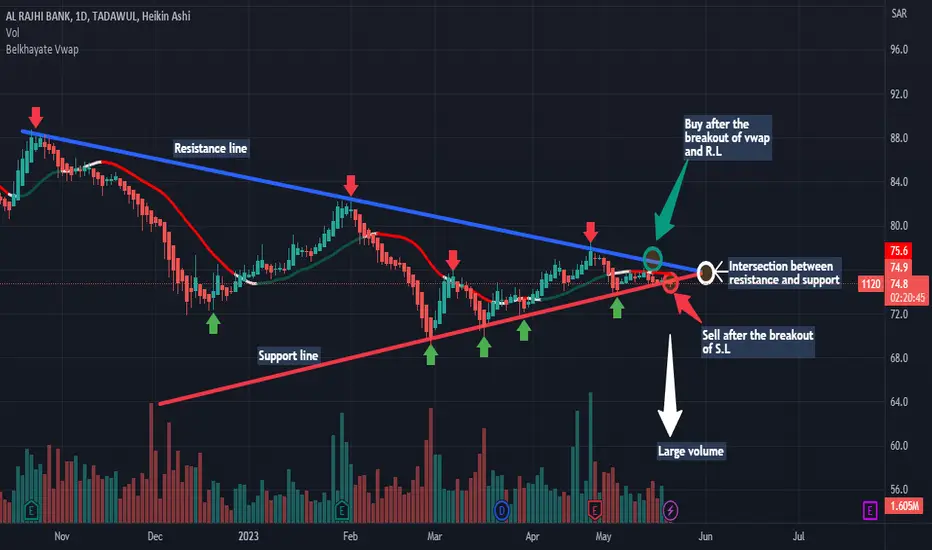
1120: AnalysisAs you see on the chart we have an intersection between resistance line and support line. So we will have a big probability to have an uptrend if we have the breakout with force the vwap and the resistance line by a big green candle with a large green volume. But, in other hand, we will have also a big probability to have a downtrend if we have the breakout with force the support line by a big red candle with a large red volume.Thanks!
ANALYSIS ON 1120Dear Saudi traders, as you can notice on the 1120 (AL Rajhi Bank) chart the price is under the VWAP with a low volume. Before you buy, you must wait for it to come above the VWAP with a quite high volume compared to the past ones. Once it does I'll share it with you so you can buy the market.
Please let me know the markets you want me to analyze for you in the comment section!

Alrajhi The Saudi Giant Stock Alrajhi has two schools suggesting its bullish move, the harmonic and classical triangle. My forecast is that the stock will hit 80 based on the tools highlight in chart.

1120: Buy ideaOn 1120 as you see on the chart we have a buy idea because we have the breakout of the vwap indicator.Thanks!

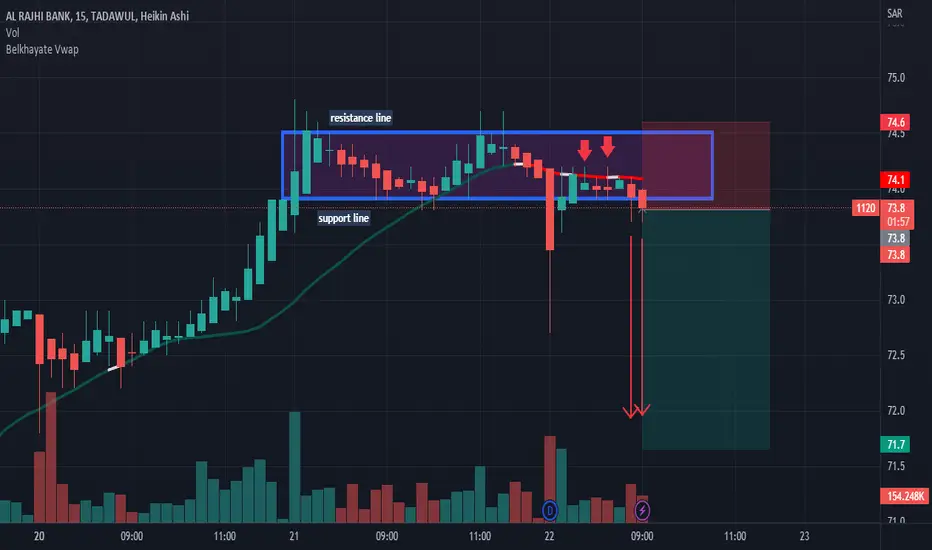
1120: Sell ideaAs you see on the chart we have a sell idea because we have the breakout of vwap and the support line. Thanks!
1120: Buy ideaOn 1120 we have a buy idea as you see on the chart because we can see a red candle with a long wick and small body with a large red volume so it's mean that we will have a big probability to have an uptrend.Thanks!
