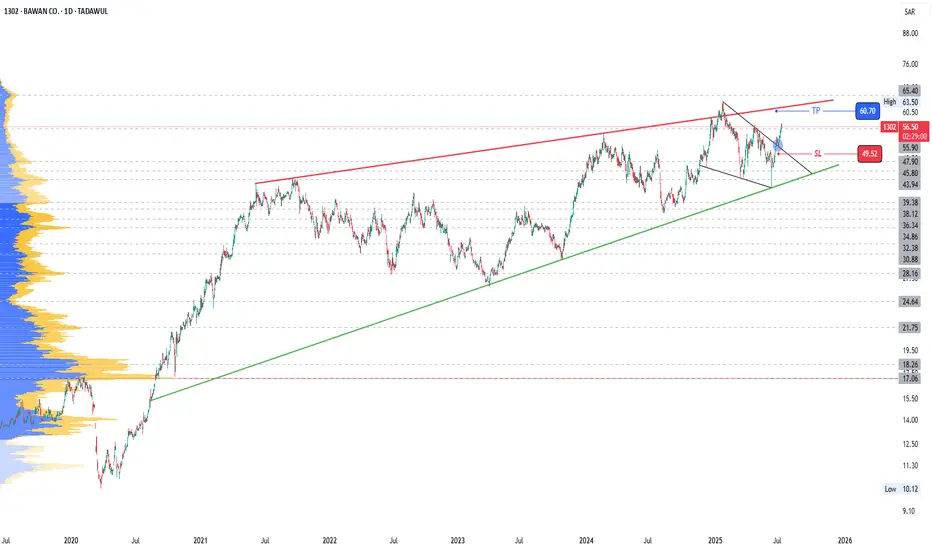
1302: Breakout of trendline resistance1302
Moving within a Rising Wedge
Price has just broken a short term resistance.
Short trade up to the top of rising wedge can be taken
Levels are marked
Trail SL accordingly.
Do proper risk management.
Watch for breakout of Rising Wedge top (Resistance)
1.90 SAR
106.03 M SAR
3.02 B SAR
34.97 M
About BAWAN CO.
Sector
Industry
CEO
Mohammed Ahmed Salman Al-Balawi
Website
Headquarters
Riyadh
Founded
1980
ISIN
SA13DG50KB18
FIGI
BBG005JZX8S6
Bawan Co. engages in the manufacture of carpentry and concrete products. It operates through the following segments: Metal and Wood, Plastic, Electrical, and Other. The Metal and Wood segment produces wooden pallets, plywood panels and boards, medium and high density coated in decoration paper, platforms, wooden bowls, and boxes. The Plastic segment is involved in plates and polystyrene foam, packaging, and insulation slices from polyethylene foam. The Electrical segment focuses on wholesale and retail of electric transformers, voltage stabilizers, battery charges, welding caustics, and electric substations equipment. The Other segment refers to the residual segment and comprises Bawan company representing only holding company and associated activities. The company was founded on August 20, 1980 and is headquartered in Riyadh, Saudi Arabia.
Related stocks
BAWANacording to my previous technical studies,i see a great opportunity with high probability of succes,the details are reflected in tge chart,good luck to all

Monthly Closing is Important!
43.80 - 44.40 may act as a Good Support.
But if this is broken, next support would be
around 42.10 - 42.70.
However, Monthly Closing above 44.40 may trigger positivity.
And it will confirm its Bullish Momentum, once
it will cross 46.80


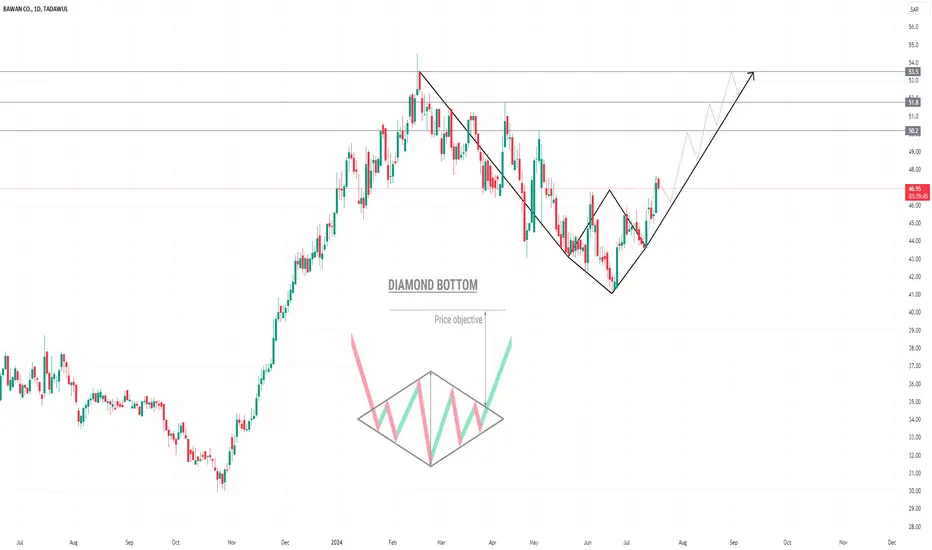
1302 | Diamond PatternThe technical chart of 1302 Bawan Company reveals a diamond pattern formation, which has recently experienced a breakout. The diamond pattern is characterized by a consolidation phase where prices initially form a narrowing range, followed by a breakout in either direction. In this case, the breakou
ANALYSIS ON 1302Dear Saudi Traders and Investors,
I saw on a group people willing to buy BAWAN (1302), I kept telling them not to buy and only few listened, please don't buy 1302, save your money or invest it on stocks that will return you profits.
You can see that the price is going down and it's heading towards

ANALYSIS ON 1302Dear Saudi Traders and Investors, I'm sharing with you an analysis on one of my favorite stocks to trade, I've been leading Investors and Traders on it for a year and half now, now while waiting for a Trade to take on it, I said why not to share an analysis with you.
Yoy can notice on the chart tha


BAWAN CO 1302Bawan Co. weekly time frame after stability above 33.40 waiting to hit 36.65 and 39.95 Good luck


See all ideas
Summarizing what the indicators are suggesting.
Oscillators
Neutral
SellBuy
Strong sellStrong buy
Strong sellSellNeutralBuyStrong buy
Oscillators
Neutral
SellBuy
Strong sellStrong buy
Strong sellSellNeutralBuyStrong buy
Summary
Neutral
SellBuy
Strong sellStrong buy
Strong sellSellNeutralBuyStrong buy
Summary
Neutral
SellBuy
Strong sellStrong buy
Strong sellSellNeutralBuyStrong buy
Summary
Neutral
SellBuy
Strong sellStrong buy
Strong sellSellNeutralBuyStrong buy
Moving Averages
Neutral
SellBuy
Strong sellStrong buy
Strong sellSellNeutralBuyStrong buy
Moving Averages
Neutral
SellBuy
Strong sellStrong buy
Strong sellSellNeutralBuyStrong buy
Displays a symbol's price movements over previous years to identify recurring trends.
Frequently Asked Questions
The current price of 1302 is 52.40 SAR — it has decreased by −1.41% in the past 24 hours. Watch BAWAN CO. stock price performance more closely on the chart.
Depending on the exchange, the stock ticker may vary. For instance, on TADAWUL exchange BAWAN CO. stocks are traded under the ticker 1302.
1302 stock has fallen by −4.73% compared to the previous week, the month change is a −0.76% fall, over the last year BAWAN CO. has showed a 8.26% increase.
1302 reached its all-time high on Aug 19, 2014 with the price of 70.85 SAR, and its all-time low was 10.10 SAR and was reached on Mar 22, 2020. View more price dynamics on 1302 chart.
See other stocks reaching their highest and lowest prices.
See other stocks reaching their highest and lowest prices.
1302 stock is 3.10% volatile and has beta coefficient of 1.66. Track BAWAN CO. stock price on the chart and check out the list of the most volatile stocks — is BAWAN CO. there?
Today BAWAN CO. has the market capitalization of 3.14 B, it has decreased by −3.27% over the last week.
Yes, you can track BAWAN CO. financials in yearly and quarterly reports right on TradingView.
BAWAN CO. revenue for the last quarter amounts to 910.00 M SAR, despite the estimated figure of 831.00 M SAR. In the next quarter, revenue is expected to reach 920.00 M SAR.
1302 net income for the last quarter is 36.51 M SAR, while the quarter before that showed 30.31 M SAR of net income which accounts for 20.43% change. Track more BAWAN CO. financial stats to get the full picture.
EBITDA measures a company's operating performance, its growth signifies an improvement in the efficiency of a company. BAWAN CO. EBITDA is 245.46 M SAR, and current EBITDA margin is 7.24%. See more stats in BAWAN CO. financial statements.
Like other stocks, 1302 shares are traded on stock exchanges, e.g. Nasdaq, Nyse, Euronext, and the easiest way to buy them is through an online stock broker. To do this, you need to open an account and follow a broker's procedures, then start trading. You can trade BAWAN CO. stock right from TradingView charts — choose your broker and connect to your account.
Investing in stocks requires a comprehensive research: you should carefully study all the available data, e.g. company's financials, related news, and its technical analysis. So BAWAN CO. technincal analysis shows the sell today, and its 1 week rating is buy. Since market conditions are prone to changes, it's worth looking a bit further into the future — according to the 1 month rating BAWAN CO. stock shows the buy signal. See more of BAWAN CO. technicals for a more comprehensive analysis.
If you're still not sure, try looking for inspiration in our curated watchlists.
If you're still not sure, try looking for inspiration in our curated watchlists.