Bullish chart for Methanol 2001Big 5th wave as you can see and now we are making base before trend changes...
I shared one before for the same share but this more clear with just targets
See you there ;)
2001 trade ideas
Favoring BullsBullish Points:
Bullish Divergence on Weekly TF.
Inverted H&S Pattern.
Slightly Bullish on Daily TF.
No Bearish Divergence.

2001 Methanol Chemicals: Monthly Bullish Order Block ReactionGreetings, traders! 🌟 I’ve identified a compelling setup in the 2001 Methanol Chemicals market on the monthly chart. Join me as we explore the potential for a lucrative trade opportunity.
Analysis:
Bullish Order Block Identification: On the monthly timeframe, a clear bullish order block is developing in the 2001 Methanol Chemicals market. This zone typically signifies sustained buying interest and potential for upward movement.
Key Price Tab Reaction: Recently, there’s been a significant reaction at a specific price tab within this bullish order block. This reaction underscores the importance of this level, potentially serving as a strong support or resistance point.
Technical Confirmation: Technical indicators, including moving averages and RSI, are aligning with the bullish bias, suggesting favorable conditions for a potential uptrend continuation.
Trade Strategy:
Entry Point: Consider initiating long positions on a confirmed breakout above the recent reaction level, signaling renewed bullish momentum.
Stop-loss Placement: Implement a stop-loss below the lowest point of the bullish order block to manage risk effectively and protect capital.
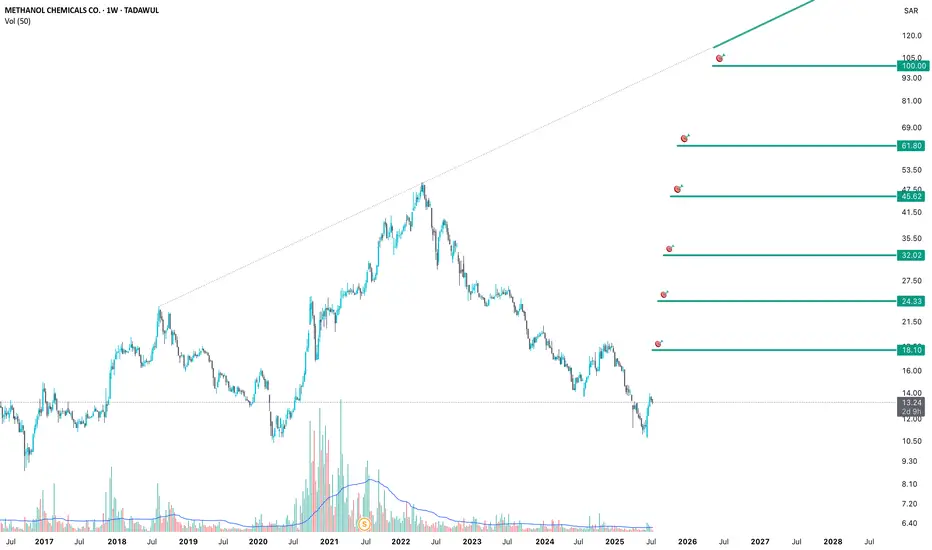
Profit Targets: Target potential upside based on Fibonacci extensions or significant historical resistance levels. Refer to the attached chart for precise target levels.
Risk Management:
Risk-Reward Ratio: Maintain a balanced risk-reward ratio to ensure that potential gains justify the risks taken in the trade.
Position Sizing: Adjust position sizes based on your risk tolerance and account size, adhering to sound risk management principles.
Conclusion:
This setup in 2001 Methanol Chemicals presents a promising opportunity based on the bullish order block and recent price tab reaction. As always, exercise caution and follow your trading plan diligently.
Chart Targets: Refer to the attached chart for specific profit targets marked with Fibonacci levels and historical resistance points.
Disclaimer: This is not financial advice. Please conduct your own research or consult a financial advisor before making any investment decisions.

2001 reverse area to create a high trend?Hello everyone,
I would like to share my analysis of this stock, which I have been following since September 2022. The price is currently in a zone that has a high probability of initiating a countertrend and starting an upward movement. I see the downside target at 16.46.
Please note that the current time might not be the best for entry, but I decided to share this analysis for those interested in following this stock. I have included an explanation in Arabic on the chart that explains how to enter the specified area, hoping that the explanation is clear to everyone.
Please be aware that I have not read the financial statements or any news about the company at all, as I do not have the time for it. This is your responsibility.
I welcome any inquiries or discussions about this analysis.

Methanol 2001 and Big Bull Run to begin!As you can see on the weekly chart,
I observe oversold conditions along with falling pattern that we are close to breaking through. Additionally, there is a divergence in the MACD.
Finally, I have also analyzed fractals.

2001| Chemanol📊 Chemanol
📈Retesting a very important support level at 17 SR and if succeeded breaking out double bottom pattern, it will achieve a 127% increase
🏷️The current price is 17.38 riyals
🏹Goals start from 20 to 50 riyals
🎯The next goal is 20 riyals if able to rebound from the current support level
Good luck
🤝Please do not forget to support, cheers, likes, comments and boost!
Thanks!

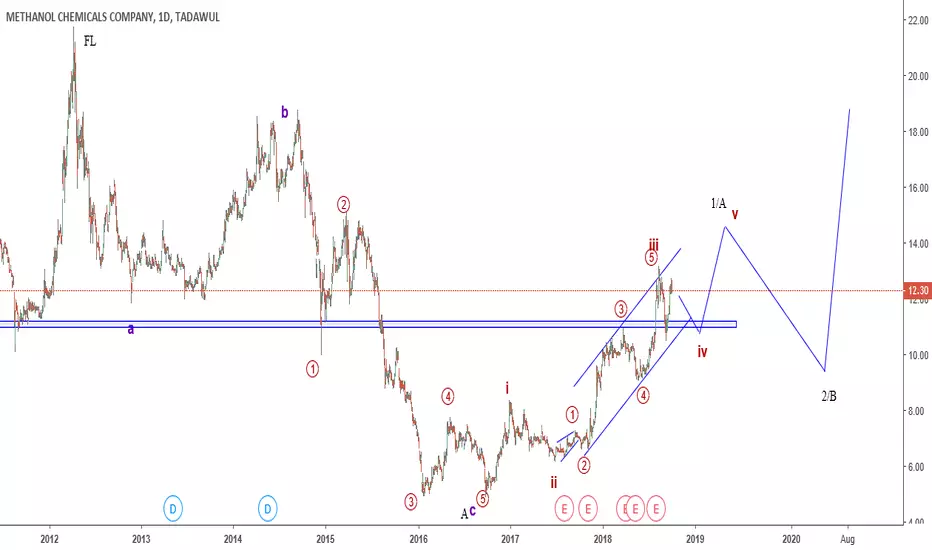
METHANOLin the annual time-frame:
if we assume this correction to be the 4th phase of an elliot move
then this wave should not enter the domain of the 1st wave
and I expect the correction to end very soon.

The Great MethanolMethanol has not experienced much price correction
I expect another 41% drop in the price in the medium run of the time.
there is a red aggregate of ichi cloud below that is untouched by the price & it idicates that the price has an inclination to see that level.

2001 | METHANOL CHEMICALS CO | 1DIts in downtrend, making lower highs and lower lows. From 2 days bulls are trying to push price upwards.
# Bearish Indicators
- Downtrend LH & LL
# Bullish Indicators
- Hammer candle
- Bounce from Trendline support
# Trade Plan
👉 Entry: 25.3
💰 TP: 26.03
🚫 SL: 23.77


2001 Stock To Sell From Portfolio!Hello ladies and gentlemen, according to my graphical analysis of METHANOL CHEMICALS CO ,I recommended to close all long position in your portfolio because 2001 stock is showing a sell signal so this is the best time to close all long position in portfolio!

What a RUN!!very nice stock in a strong bull run also it hit 52 weeks high. Once a stock hits all time high there are very good chances that it will continue flying higher. If from Sunday over all market is positive this stock will surely grab many eye balls and go up. Very Bullish!!!!
Hit like & follow guys ;)


WE STILL HAVE FRESH BREATH TO REACH THE TARGET LEVELthis is an analysis for one of the best SAUDI ARABIA STOCKS,
stay a buyer


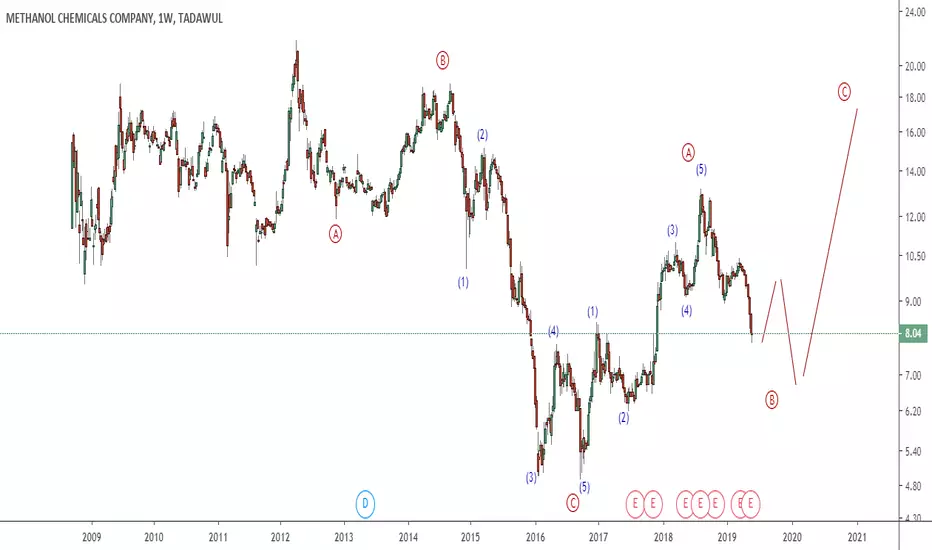
Methanol Chemicals - Tadawul - Possible Wave 3 :) Hello Traders;
As you can read from my chart, we might be at the end of Wave 2 and possible wave 3 starts; placing a buy stop on 8.06 SAR with loss top on 7.78 SAR. Wave 3 is only confirmed when a new high is achieved :)
Happy freaking trading :)