A TRADE WE'RE HOLDING We've been holding this trade on 2040 for a month now in which we're doing great so far despite the Market slow movement.
The entry on this trade is based on liquidity and market gaps in case you wondered!
Meanwhile, there's a golden opportunity for those who wants to learn how to trade Saudi Mar
Next report date
—
Report period
—
EPS estimate
—
Revenue estimate
—
0.58 SAR
−71.86 M SAR
1.35 B SAR
93.93 M
About SAUDI CERAMIC CO.
Sector
Industry
Website
Headquarters
Riyadh
Founded
1977
ISIN
SA0007879154
FIGI
BBG000BJRYW6
Saudi Ceramic Co. engages in the production and sale of ceramic products, water heaters and their components. The firm is also involved in the import of related machineries, equipment and other accessories. It operates through the Ceramic Tiles and Sanitary Ware, and Water Heaters segments. The Ceramic Tiles and Sanitary Ware segment manufactures and distributes ceramic and porcelain tiles and sanitary ware items. The Water Heaters segment is involved in the manufacture and distribution of electric water heaters. The company was founded on April 14, 1977 and is headquartered in Riyadh, Saudi Arabia.
Related stocks

Trading Idea - Saudi Ceramic (2040) | Monthly Chart with Inverte🧠 Trading Idea - Saudi Ceramic (2040) | Monthly Chart with Inverted FVG
🔍 Chart Context:
Price has reacted from a Monthly Inverted Fair Value Gap (IFVG ), indicating a potential premium-level supply zone.
This rejection confirms sellers’ presence at the premium pricing zone, causing a sharp drop.

TP REACHED ON 2040One of the trades I gave to my clients and I shared to the public is this one on 2040, as you can see, the market have reached our TP and reversed right away.
BY the grace of Allah, all of the 5 trades we took for the past 2 month have reached the tp, and all of my clients are satisfied with the re

UPDATE ON 2040A month ago, I posted to buy 2040 at 33.60, the market reached the entry Thursday, and now it is heading toward the target.
This is one of the 6 trades we took last week and still waiting for other configurations to get confirmed.
You still can buy 2040.
Follow for more!

BUY 2040Saw on a group people wondering if it's still time to buy on 2040 and I wanted to share with you this entry you still can take.
Wait for the market to come back to Fill the Gap and Grab the Liquidity at the same time so you can have a clean entry.
Entry at 33.60, Target at 37.20 and Stop at 31.80

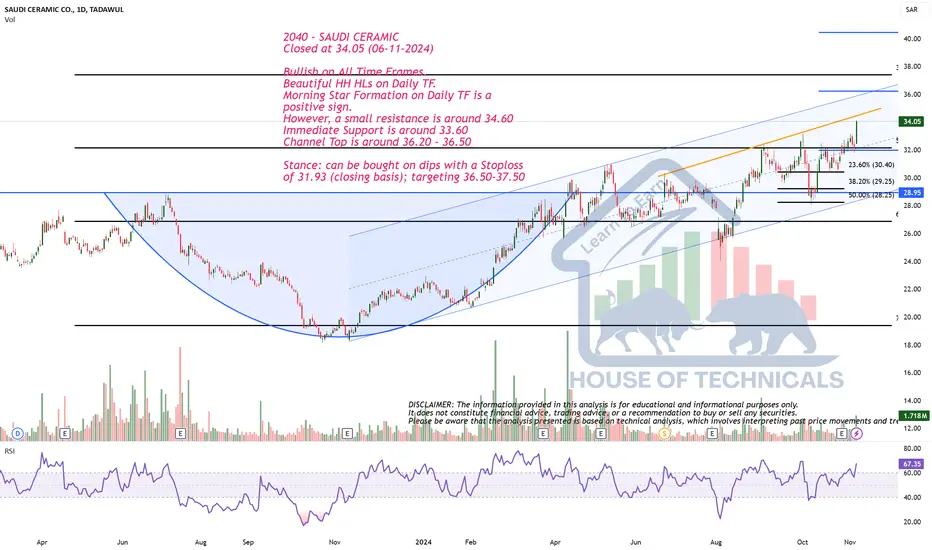
Bullish on All Time Frames.
Bullish on All Time Frames.
Beautiful HH HLs on Daily TF.
Morning Star Formation on Daily TF is a
positive sign.
However, a small resistance is around 34.60
Immediate Support is around 33.60
Channel Top is around 36.20 - 36.50
Stance: can be bought on dips with a Stoploss
of 31.93 (closing basis
WAIT BEFORE YOU BUY 2040As you can notice on the chart, the market still got some gaps to fill before going Bullish.
To buy on 2040 you must wait for the market to fill all the gaps then you can have a safe entry.
Let me know the stocks you're holding in losses.

2040| SAUDI CERAMIC CO.SAUDI CERAMIC CO
Trend reversal broke through descending triangle
Target (White), support (Red) and resistance (Green) as in charts
Next targets: 29.65 > 32.25> 35.55
Good luck!


DON'T BUY 2040Dear Saudi Traders and Investors,
2040 is one of the stocks I get asked about if there's an entry on it or no, and I posted about it 2 months ago and the stock is still heading down.
For now there's nothing to do since there's no sign of a squeeze or a pullback on a level, the stock will keep going

See all ideas
Summarizing what the indicators are suggesting.
Neutral
SellBuy
Strong sellStrong buy
Strong sellSellNeutralBuyStrong buy
Neutral
SellBuy
Strong sellStrong buy
Strong sellSellNeutralBuyStrong buy
Neutral
SellBuy
Strong sellStrong buy
Strong sellSellNeutralBuyStrong buy
An aggregate view of professional's ratings.
Neutral
SellBuy
Strong sellStrong buy
Strong sellSellNeutralBuyStrong buy
Neutral
SellBuy
Strong sellStrong buy
Strong sellSellNeutralBuyStrong buy
Neutral
SellBuy
Strong sellStrong buy
Strong sellSellNeutralBuyStrong buy
Displays a symbol's price movements over previous years to identify recurring trends.
Frequently Asked Questions
The current price of 2040 is 30.60 SAR — it hasn't changed in the past 24 hours. Watch SAUDI CERAMIC CO. stock price performance more closely on the chart.
Depending on the exchange, the stock ticker may vary. For instance, on TADAWUL exchange SAUDI CERAMIC CO. stocks are traded under the ticker 2040.
2040 stock has fallen by −6.99% compared to the previous week, the month change is a 2.07% rise, over the last year SAUDI CERAMIC CO. has showed a 7.56% increase.
We've gathered analysts' opinions on SAUDI CERAMIC CO. future price: according to them, 2040 price has a max estimate of 28.80 SAR and a min estimate of 22.50 SAR. Watch 2040 chart and read a more detailed SAUDI CERAMIC CO. stock forecast: see what analysts think of SAUDI CERAMIC CO. and suggest that you do with its stocks.
2040 reached its all-time high on Aug 13, 2014 with the price of 58.04 SAR, and its all-time low was 9.38 SAR and was reached on Oct 14, 2018. View more price dynamics on 2040 chart.
See other stocks reaching their highest and lowest prices.
See other stocks reaching their highest and lowest prices.
2040 stock is 2.70% volatile and has beta coefficient of 1.52. Track SAUDI CERAMIC CO. stock price on the chart and check out the list of the most volatile stocks — is SAUDI CERAMIC CO. there?
Today SAUDI CERAMIC CO. has the market capitalization of 3.05 B, it has decreased by −0.53% over the last week.
Yes, you can track SAUDI CERAMIC CO. financials in yearly and quarterly reports right on TradingView.
SAUDI CERAMIC CO. is going to release the next earnings report on Oct 20, 2025. Keep track of upcoming events with our Earnings Calendar.
2040 net income for the last quarter is 112.80 M SAR, while the quarter before that showed 21.12 M SAR of net income which accounts for 434.05% change. Track more SAUDI CERAMIC CO. financial stats to get the full picture.
EBITDA measures a company's operating performance, its growth signifies an improvement in the efficiency of a company. SAUDI CERAMIC CO. EBITDA is 126.93 M SAR, and current EBITDA margin is 7.60%. See more stats in SAUDI CERAMIC CO. financial statements.
Like other stocks, 2040 shares are traded on stock exchanges, e.g. Nasdaq, Nyse, Euronext, and the easiest way to buy them is through an online stock broker. To do this, you need to open an account and follow a broker's procedures, then start trading. You can trade SAUDI CERAMIC CO. stock right from TradingView charts — choose your broker and connect to your account.
Investing in stocks requires a comprehensive research: you should carefully study all the available data, e.g. company's financials, related news, and its technical analysis. So SAUDI CERAMIC CO. technincal analysis shows the neutral today, and its 1 week rating is buy. Since market conditions are prone to changes, it's worth looking a bit further into the future — according to the 1 month rating SAUDI CERAMIC CO. stock shows the buy signal. See more of SAUDI CERAMIC CO. technicals for a more comprehensive analysis.
If you're still not sure, try looking for inspiration in our curated watchlists.
If you're still not sure, try looking for inspiration in our curated watchlists.