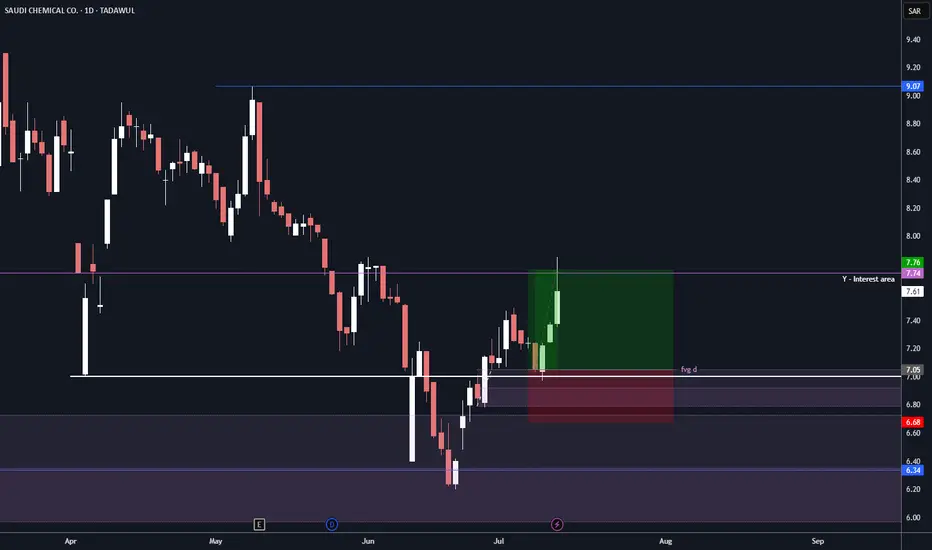
Bullish Signs on 2230 TASI Trade was on 2230 reason to enter:
Bounce from Monthly level blue line which also MONTH FVG.
Fake breakout white line in Monthly.
Entry in Daily FVG.
Target 2RR
0.33 SAR
291.24 M SAR
6.38 B SAR
749.50 M
About SAUDI CHEMICAL CO.
Sector
Industry
CEO
Abdulsalam Musfer Al Ghamdi
Website
Headquarters
Riyadh
Founded
1972
ISIN
SA0007879402
FIGI
BBG000KYV4H1
Saudi Chemical Co. engages in the manufacture and sale of explosives and related products for civil and military uses. It operates through the following segments: Explosives, Medicine and Medical Supplies, and Production of Ammonium Nitrate. Its products include electronic detonators, blasting agents, initiation systems, seismic explosives, and accessories. The company was founded on March 25, 1972 and is headquartered in Riyadh, Saudi Arabia.
Related stocks
2230 - Saudi CHemical CO Short Set upForming Double top pattern with bearish divergence. Have my sell stop / entry at 10.80.
entry - 10.80
stoploss - 11.32
tp-1 - 10.28
tp-2 9.77
#Trading #Technical #Crypto #Stocks #commodities

SAUDI CHEMICAL COIn finance, a "gap up" refers to a scenario where the price of a financial instrument, such as a stock, commodity, or currency, opens significantly higher than its previous closing price. This often occurs due to positive news, earnings reports, or other market-moving events that occur outside of re


2230 is hitting 5.5 SRThe price is going to hit 6-5.5 for closing the gabs/retesting/Simple correction
then it is going to hit the green zone again up as a retest

2230| Saudi Chemical Company📊 Saudi Chemical Company
📈 Updated analysis!
💰25 % gain achieved since last analysis
Forming triple bottom and retesting for breakout. After breakout confirmation, will form uprising channels.
🏹 Targets and other details in chart
Good luck!
Please do not forget to support, cheers, like, com

2230| Saudi Chemical Holding CompanySaudi Chemical Holding Company
Bullish broke ascending triangle as predicted now trading in ascending parallels channels
All targets so far achieved 4.76, 5.05, and 5.20
Targets/resistance (Green) and support (Red) as in the chart
Good luck!

2230| Saudi Chemical Holding CompanySaudi Chemical Holding Company
Bullish
Targets/resistance and support as in the chart
Good luck!

2230| Saudi Chemical CoSaudi Chemical Co
Broke out its symmetrical triangle!
Great long-term entry
Next target 5.10 SR
Good luck!

See all ideas
Summarizing what the indicators are suggesting.
Oscillators
Neutral
SellBuy
Strong sellStrong buy
Strong sellSellNeutralBuyStrong buy
Oscillators
Neutral
SellBuy
Strong sellStrong buy
Strong sellSellNeutralBuyStrong buy
Summary
Neutral
SellBuy
Strong sellStrong buy
Strong sellSellNeutralBuyStrong buy
Summary
Neutral
SellBuy
Strong sellStrong buy
Strong sellSellNeutralBuyStrong buy
Summary
Neutral
SellBuy
Strong sellStrong buy
Strong sellSellNeutralBuyStrong buy
Moving Averages
Neutral
SellBuy
Strong sellStrong buy
Strong sellSellNeutralBuyStrong buy
Moving Averages
Neutral
SellBuy
Strong sellStrong buy
Strong sellSellNeutralBuyStrong buy
Displays a symbol's price movements over previous years to identify recurring trends.
Frequently Asked Questions
The current price of 2230 is 7.63 SAR — it has increased by 0.39% in the past 24 hours. Watch SAUDI CHEMICAL CO. stock price performance more closely on the chart.
Depending on the exchange, the stock ticker may vary. For instance, on TADAWUL exchange SAUDI CHEMICAL CO. stocks are traded under the ticker 2230.
2230 stock has risen by 4.52% compared to the previous week, the month change is a 7.46% rise, over the last year SAUDI CHEMICAL CO. has showed a −31.14% decrease.
2230 reached its all-time high on Sep 4, 2024 with the price of 12.24 SAR, and its all-time low was 1.27 SAR and was reached on Nov 26, 2008. View more price dynamics on 2230 chart.
See other stocks reaching their highest and lowest prices.
See other stocks reaching their highest and lowest prices.
2230 stock is 1.85% volatile and has beta coefficient of 1.65. Track SAUDI CHEMICAL CO. stock price on the chart and check out the list of the most volatile stocks — is SAUDI CHEMICAL CO. there?
Today SAUDI CHEMICAL CO. has the market capitalization of 6.43 B, it has increased by 1.22% over the last week.
Yes, you can track SAUDI CHEMICAL CO. financials in yearly and quarterly reports right on TradingView.
2230 net income for the last quarter is 82.33 M SAR, while the quarter before that showed 54.08 M SAR of net income which accounts for 52.23% change. Track more SAUDI CHEMICAL CO. financial stats to get the full picture.
Yes, 2230 dividends are paid annually. The last dividend per share was 0.05 SAR. As of today, Dividend Yield (TTM)% is 0.66%. Tracking SAUDI CHEMICAL CO. dividends might help you take more informed decisions.
SAUDI CHEMICAL CO. dividend yield was 0.54% in 2024, and payout ratio reached 14.48%. The year before the numbers were 1.17% and 23.05% correspondingly. See high-dividend stocks and find more opportunities for your portfolio.
EBITDA measures a company's operating performance, its growth signifies an improvement in the efficiency of a company. SAUDI CHEMICAL CO. EBITDA is 495.49 M SAR, and current EBITDA margin is 7.70%. See more stats in SAUDI CHEMICAL CO. financial statements.
Like other stocks, 2230 shares are traded on stock exchanges, e.g. Nasdaq, Nyse, Euronext, and the easiest way to buy them is through an online stock broker. To do this, you need to open an account and follow a broker's procedures, then start trading. You can trade SAUDI CHEMICAL CO. stock right from TradingView charts — choose your broker and connect to your account.
Investing in stocks requires a comprehensive research: you should carefully study all the available data, e.g. company's financials, related news, and its technical analysis. So SAUDI CHEMICAL CO. technincal analysis shows the buy rating today, and its 1 week rating is neutral. Since market conditions are prone to changes, it's worth looking a bit further into the future — according to the 1 month rating SAUDI CHEMICAL CO. stock shows the buy signal. See more of SAUDI CHEMICAL CO. technicals for a more comprehensive analysis.
If you're still not sure, try looking for inspiration in our curated watchlists.
If you're still not sure, try looking for inspiration in our curated watchlists.