Stock is in DownTrend but ..4013 CMP 254.20 (15-06-2025)
Stock is in DownTrend but it Beautifully hit Channel
Bottom & Bounced.
Currently at a Good Support level.
Now the Immediate Resistance is around 256 - 257
& then around 270.
Crossing this level & Sustaining on Monthly basis would
lead it towards 283 - 285 initially.
However, should not break 253 - 254.
4013 trade ideas

Al Habib Stock Watch | Development Proposal Impact📈
Symbol: TADAWUL:4013
Sector: Healthcare
Hello traders and investors,
Today I’m analyzing Al Habib Medical Group’s stock performance alongside a key development initiative I personally proposed to Dr. Sulaiman Al Habib himself.
📊 Stock Price Movement
Over the past weeks, Al Habib stock has shown resilience despite broader market fluctuations. We’ve seen support holding around key levels, with buyers stepping in on dips. The technical setup suggests accumulation, possibly in anticipation of new business developments or Q2 earnings.
🧪 Development Proposal – Pharmacy Division
Recently, I submitted a strategic development proposal to Dr. Al Habib focused on enhancing the Pharmacy Department across the group. The proposal includes:
Digital transformation of pharmacy services
Introduction of AI-driven inventory management
Expansion into ePharmacy platforms
Enhancing customer experience and medication adherence via tech
Dr. Al Habib kindly acknowledged the proposal and responded with appreciation, noting that he would refer it to the appropriate person within the organization.
📈 Impact on Stock Price
If implemented, this initiative could have a strong positive impact on revenue and operational efficiency, particularly by:
Increasing pharmacy profitability
Attracting tech-savvy customers
Positioning Al Habib as a leader in healthcare innovation
As investors begin to factor in the potential for tech-driven growth, we may see upward price action as confidence builds.
🔎 Final Thoughts
Keep an eye on news related to internal development or digital health expansion. Strategic innovation, especially in a critical vertical like pharmacy, can be a catalyst for long-term stock appreciation.
Feel free to share your thoughts or technical views in the comments 👇
#AlHabib #4013 #SaudiStocks #PharmacyTech #Innovation #HealthcareStocks #TradingView

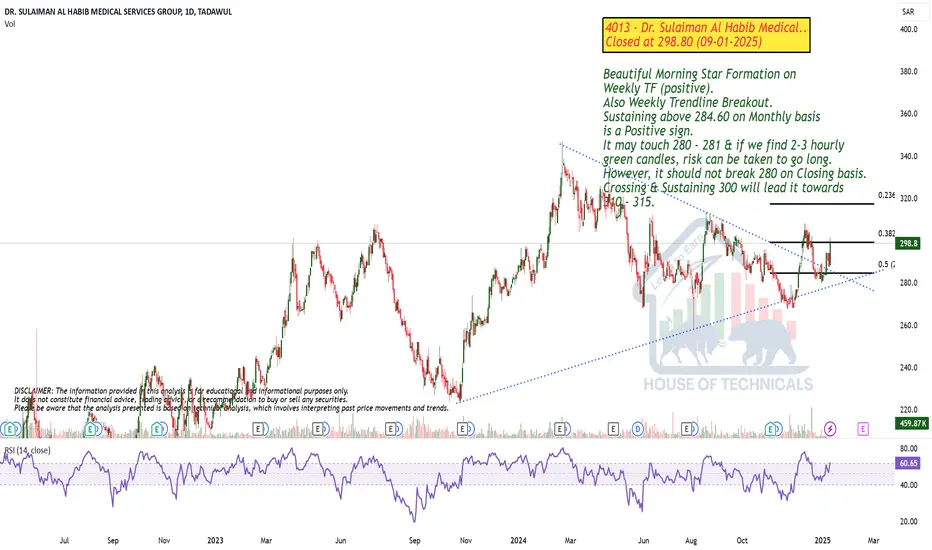
Beautiful Morning Star Beautiful Morning Star Formation on
Weekly TF (positive).
Also Weekly Trendline Breakout.
Sustaining above 284.60 on Monthly basis
is a Positive sign.
It may touch 280 - 281 & if we find 2-3 hourly
green candles, risk can be taken to go long.
However, it should not break 280 on Closing basis.
Crossing & Sustaining 300 will lead it towards
310 - 315.
DR SULAIMAN AL HABIB MEDICAL SERVICES acording to my previous technical studies,i see a great opportunity with high probability of succes,the details are reflected in tge chart,good luck to all

4013: Sell ideaSell idea on 4013 because after the breakout the vwap indicator we have a pullback on the vwap so it's mean that we would have a hight probability to have a downtrend.

4013 dr sulaiman al habib4013 dr sulaiman al habib
falling agter buy stops.
target weekly imbalance mention on chart.

Trade WiselyMonthly Bearish Divergence
However, tested the Breakout level around 308 - 309
Entry can be taken with a Strict Stoploss of 300
on Closing Basis

Dr Sulaiman Medical (4013) seems going bullish1-hour chart, the stock is trading in a rising channel.
After crossing resistance blue line (around 305), the target will be 311
Tech. Indicators RSI and MACD are positive
stop loss under support line (red) to be considered

4013After confirming bullish cypher pattern, price is in uptrend and is targeting towards 305. Currently trading around 282.

4013: Watchout for trendline Breakout4013 has been in correction after making ATH.
A significant support (Ascending trendline) was broken in recent past for the first time.
After completion of Harmonic Pattern, Double Bottom formation, a short upside move is observed (formation of HH, HL).
However, ascending trendline will be acting as resistance now.
Although, breakout of trendline was observed during the recent bullish trend, but couldn't sustain.
Wathout for breakout of ascending trendline resistance for long entry.
Trade with SL

4013 DU SULAIMN AL HABIB MEDICALEVERY CANDLE HAS LIQUIDITY.
PRICE ALWAYS NEED LIQUIDITY.
Nobody Knows Where is Price Going.
Hey traders, here is the analysi.
If you guys like my analysis please hit like?? and follow.
Thanks.
DISCLAIMER- This is not financial advice.
SMART MONEY CONCEPT.
identify Liquidity Or Become Liquidity

4013 (Triangle Breakout)Price is in continuous uptrend
Breakout of Triangle (Trendline resistance) is observed.
Trail Stop Loss to enjoy the ride
SL, TPs are specified.

BUY 4013Dear Saudi traders, here's another stock for you to buy tomorrow's trading session, buy it an pay attention for the highest high the market reached.
TP and SL set them at your own risk.
Don't hesitate to leave a comment in case you got any questions.

4013: Sulaiman Al-Habib (Rising Wedge Breakout and Retest)Continuously in Uptrend within Ascending Wedge
Completing several triangle targets
Recently, Breakout of Rising Wedge Top (Trendline) and Retest observed
Hidden Bullish Divergences are observed on Daily and Hourly TF
Entry at CMP with specified SL (aggressive entry)
Wait for another green candle for entry (conservative entry)
Targets are specified, ride the trend with trailing SL.

4013: Sulaiman Al-Habib (Triangle Breakout)Triangle Pattern Breakout
All Time High
Historically completing Triangle Pattern Targets
Levels are mentioned with tight SL

4013: Dr Sulaiman Al-Habib (Bullish Setup)Historical Formations of triangle patterns and target completion
Price is ranging within another Triangle formation recently
Watch for breakout for entry (Aggressive)
Wait for Retest/HL formation (Conservative)
Stop loss at trendline support
Trail stop loss until specified target levels
Manage your trades and risk

4013: Dr Sulaiman Al-Habib Medi Srvcs Grp Co TADAWUL4013 is has taken support for an upside movement
Touching bottom ascending trendline support (Very strong support since 2020)
Biased: Bullish
Take buy position with stop loss
Ride with trailing stop loss

TASI, 4013, Dr Sulaiman Al-Habib Medi Srvcs Grp Co TADAWUL4013 is ranging within symmetrical triangle
Touching bottom ascending trendline support (Very strong support since 2020)
Expected Fib retracement between 61.8% and 78.6%
Everytime it touch Ascending trendline support, it bounce
Biased: Bullish
There can be two possible scenarios
1) Bullish:
Short bullish trade until top descending trendline resistance.
Breakout (after reaching top descending trendline resistance)
Further Long position can be taken if bulls managed to close above upper wedge
(Trail your stop loss)
2) Bearish Rejection (Breakdown of symmetrical triangle)
If bearish candles formed breaking the lower support.
Trade your levels accordingly.

4013 bearish movement we had an ideal head & shoulder pattern and a weak bullish candle(lower price rejection) +the RSI supports the short movement

DR. SULAIMAN AL HABIB MEDICAL SERVICES GROUP BUYstrong signal to buy
-broke the trend line with interesting volume

Alhabib 4031 We have a hammer candle on support area and near 50MA
we will watch for strength by RSI crossing above 50
in general a good stock in up trend


4013 (TADAWUL) - Bullish TrendHumbled, we would like to thanks for your support who has already liked, commented and followed us. Your support, strengthens us, to help in analyzing the market.
If you have any questions, do not be hesitant to send us message (inbox). Again, We have also provide signal recommendation with detail instruction
4013 (TADAWUL) - Bullish Trend
