Extremely Bullish.
Extremely Bullish.
Took Support from a very Important level around 136 - 140.
Hidden Bullish Divergence has appeared.
176 - 182 is a Resistance Zone.
Crossing & Sustaining 201, lead it towards 235 - 237.
On the flip side, 170 & 161 - 162 seems to be a Good Support level.
Next report date
—
Report period
—
EPS estimate
—
Revenue estimate
—
6.2 SAR
356.52 M SAR
1.32 B SAR
27.37 M
About JAMJOOM PHARMACEUTICALS FACTORY CO.
Sector
Industry
CEO
Tarek Youssef Hosni
Website
Headquarters
Jeddah
Founded
1994
ISIN
SA15QGU1UNH6
FIGI
BBG01C5P2446
Jamjoom Pharmaceuticals Factory Co. engages in the development, manufacturing, and marketing of generic pharmaceutical products. It operates through Pharmaceutical Products and Consumer Health Products segments. The Pharmaceutical Products segment represents medicines or drugs that are essential for the prevention and treatment of diseases, and protection of public health. The Consumer Health Products segment covers products that does not require the oversight of a health care practitioner. The firm's products are primarily sold in Saudi Arabia, Egypt, Iraq, Gulf countries, and North Africa countries. The company was founded by Yousuf Mohammed Salah Abdulaziz Jamjoom on September 22, 1994 and is headquartered in Jeddah, Saudi Arabia.
Related stocks

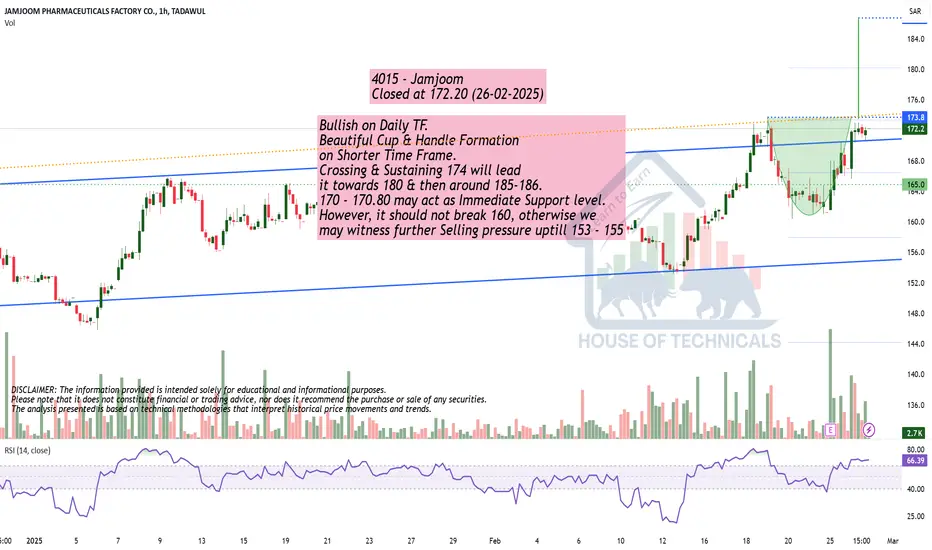
Bullish on Daily TF.Bullish on Daily TF.
Beautiful Cup & Handle Formation
on Shorter Time Frame.
Crossing & Sustaining 174 will lead
it towards 180 & then around 185-186.
170 - 170.80 may act as Immediate Support level.
However, it should not break 160, otherwise we
may witness further Selling pressure uptill 153 - 155
4015: Correction (Watchout for reversal_Golden Pocket??)4015
Continuously forming HH and HL
Bullish Flag Pole and C&H target complete
Bearish Divergences are appearing on Daily and Weekly time frames.
Candlesticks on weekly are clearly showing dominance of bears
A correction is expected.
Price currently at Golden Pocket, Watchout for reversal

4015: Breakout and Retest Parallel ChannelPrice moving in uptrend; HH, HL formation
Parallel Channel breakout and retest is observed
Watchout for double top formation
beating ATH will take the price to Bullish Flag Target.

4015: Neckline BreakoutPrice is moving in Cup formation (continuous formation of HH, HL)
A significant Neckline (Resistance) is broken.
Wait for retest for a conservative entry.
Trade as per risk.


Making HH HL on Daily TF.
Bullish on All Time Frames.
However, Slight Bearish Divergence on Hourly TF;
which may bring the price towards 144.50 -145.50
& then around 136 - 137.
Important Resistance around 158 -159.
Sustaining 159 with Good Volumes will expose
New Highs, may be around 180s.
Note that Initial Resistance is a

Jamjoom
A bearish butterfly is a specific chart pattern used in technical analysis within the realm of Harmonic Trading. This pattern helps traders identify potential reversal points in the price of an asset, typically indicating that the asset's price may reverse from an uptrend to a downtrend.
Key Featu

4015 JAMJOOMStop Buying
4015 JAMJOOM Pharma
monthly bisi>monthly imbalance created>ltf Confermation.
Target mention on chart.

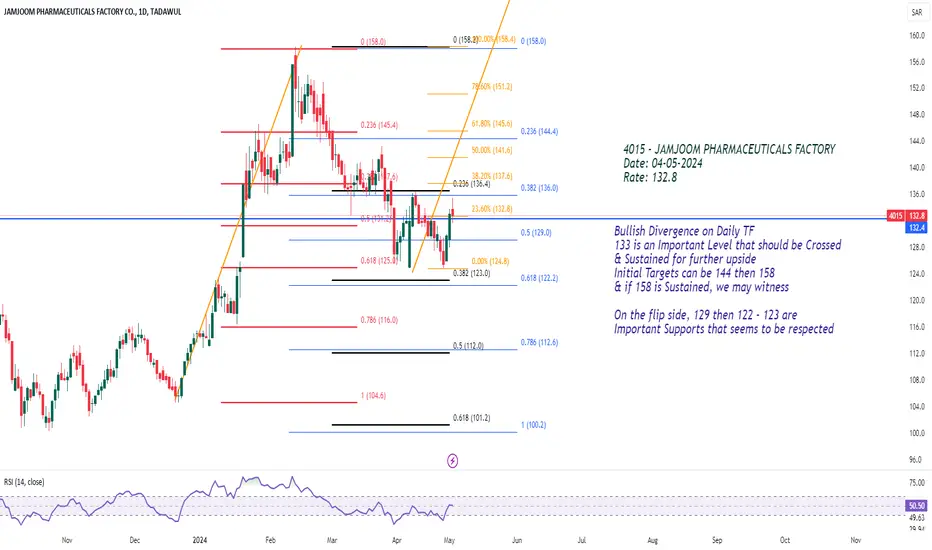
Bullish Divergence on Daily TF
133 is an Important Level that should be Crossed
& Sustained for further upside
Initial Targets can be 144 then 158
& if 158 is Sustained, we may witness
On the flip side, 129 then 122 - 123 are
Important Supports that seems to be respected
See all ideas
Summarizing what the indicators are suggesting.
Neutral
SellBuy
Strong sellStrong buy
Strong sellSellNeutralBuyStrong buy
Neutral
SellBuy
Strong sellStrong buy
Strong sellSellNeutralBuyStrong buy
Neutral
SellBuy
Strong sellStrong buy
Strong sellSellNeutralBuyStrong buy
An aggregate view of professional's ratings.
Neutral
SellBuy
Strong sellStrong buy
Strong sellSellNeutralBuyStrong buy
Neutral
SellBuy
Strong sellStrong buy
Strong sellSellNeutralBuyStrong buy
Neutral
SellBuy
Strong sellStrong buy
Strong sellSellNeutralBuyStrong buy
Displays a symbol's price movements over previous years to identify recurring trends.
Frequently Asked Questions
The current price of 4015 is 162.5 SAR — it has decreased by −0.55% in the past 24 hours. Watch JAMJOOM PHARMACEUTICALS FACTORY CO. stock price performance more closely on the chart.
Depending on the exchange, the stock ticker may vary. For instance, on TADAWUL exchange JAMJOOM PHARMACEUTICALS FACTORY CO. stocks are traded under the ticker 4015.
4015 stock has fallen by −0.25% compared to the previous week, the month change is a −2.92% fall, over the last year JAMJOOM PHARMACEUTICALS FACTORY CO. has showed a 9.06% increase.
We've gathered analysts' opinions on JAMJOOM PHARMACEUTICALS FACTORY CO. future price: according to them, 4015 price has a max estimate of 187.00 SAR and a min estimate of 167.20 SAR. Watch 4015 chart and read a more detailed JAMJOOM PHARMACEUTICALS FACTORY CO. stock forecast: see what analysts think of JAMJOOM PHARMACEUTICALS FACTORY CO. and suggest that you do with its stocks.
4015 reached its all-time high on Sep 19, 2024 with the price of 202.4 SAR, and its all-time low was 66.0 SAR and was reached on Jun 20, 2023. View more price dynamics on 4015 chart.
See other stocks reaching their highest and lowest prices.
See other stocks reaching their highest and lowest prices.
4015 stock is 0.99% volatile and has beta coefficient of 0.78. Track JAMJOOM PHARMACEUTICALS FACTORY CO. stock price on the chart and check out the list of the most volatile stocks — is JAMJOOM PHARMACEUTICALS FACTORY CO. there?
Yes, you can track JAMJOOM PHARMACEUTICALS FACTORY CO. financials in yearly and quarterly reports right on TradingView.
JAMJOOM PHARMACEUTICALS FACTORY CO. is going to release the next earnings report on Nov 11, 2025. Keep track of upcoming events with our Earnings Calendar.
4015 net income for the last quarter is 132.02 M SAR, while the quarter before that showed 157.03 M SAR of net income which accounts for −15.93% change. Track more JAMJOOM PHARMACEUTICALS FACTORY CO. financial stats to get the full picture.
JAMJOOM PHARMACEUTICALS FACTORY CO. dividend yield was 2.01% in 2024, and payout ratio reached 60.08%. The year before the numbers were 2.19% and 59.85% correspondingly. See high-dividend stocks and find more opportunities for your portfolio.
As of Aug 8, 2025, the company has 1.08 K employees. See our rating of the largest employees — is JAMJOOM PHARMACEUTICALS FACTORY CO. on this list?
EBITDA measures a company's operating performance, its growth signifies an improvement in the efficiency of a company. JAMJOOM PHARMACEUTICALS FACTORY CO. EBITDA is 481.10 M SAR, and current EBITDA margin is 31.70%. See more stats in JAMJOOM PHARMACEUTICALS FACTORY CO. financial statements.
Like other stocks, 4015 shares are traded on stock exchanges, e.g. Nasdaq, Nyse, Euronext, and the easiest way to buy them is through an online stock broker. To do this, you need to open an account and follow a broker's procedures, then start trading. You can trade JAMJOOM PHARMACEUTICALS FACTORY CO. stock right from TradingView charts — choose your broker and connect to your account.
Investing in stocks requires a comprehensive research: you should carefully study all the available data, e.g. company's financials, related news, and its technical analysis. So JAMJOOM PHARMACEUTICALS FACTORY CO. technincal analysis shows the strong sell today, and its 1 week rating is sell. Since market conditions are prone to changes, it's worth looking a bit further into the future — according to the 1 month rating JAMJOOM PHARMACEUTICALS FACTORY CO. stock shows the neutral signal. See more of JAMJOOM PHARMACEUTICALS FACTORY CO. technicals for a more comprehensive analysis.
If you're still not sure, try looking for inspiration in our curated watchlists.
If you're still not sure, try looking for inspiration in our curated watchlists.