Falling Wedge Pattern in play.4164 CMP 123.40 (15-06-2025)
Falling Wedge Pattern in play.
Even in worst cases, if 112 is not broken,
we may see upside towards 133, 145 & then
probably around 170+
4164 trade ideas

Beautiful Monthly Closing.
Closed at 122 (29-05-2025)
Beautiful Monthly Closing.
However, 125 - 126 is an Important
Resistance that needs to Sustain for
further upside.
Entry can be taken with a Stoploss below
117; targeting 125 - 126 initially.

Nahdi Medical Co. (4164) - False Breakdown & Trendline Breakout?🚨 Nahdi Medical Co. (4164) recently experienced a false breakdown below 115.6, but has since recovered above it. With the stock now testing a downward trendline, crossing this line could signal the start of a new upward move. 📈
💡 Key Points:
• Current Price: 115.2
• False Breakdown at: 115.6
• Key Resistance at: 118
• Support/Stop Loss: 111.6
• Target: Potential upward swing after breaking 118
📊 Technical Analysis: The false breakdown below 115.6 followed by a recovery signals a potential bullish reversal. If the stock breaks the downward trendline and crosses above 118, it will confirm a new upward swing.
📈 Trade Strategy: The price range between 111.6 and 118 is an ideal buying zone. A breakout above the downward trendline and 118 will confirm the start of a new upward wave. Enter with a stop loss at 111.6, and if 118 is breached, expect the rally to continue.
What are your thoughts on Nahdi Medical Co.’s price action? If you think I missed something or see a different pattern, feel free to share!🔥

NAHDI MEDICAL CO. is BullishPrice was in a declining phase, and respecting a descending a trendline, however a double bottom pattern with bullish divergence emerged on daily time frame, hinting the return bulls. If the trendline and previous lower high are broken successfully, then we can expect a bullish reversal as per Dow theory. Targets are mentioned on the chart.

Nahdi Medical (4164) Tadawul: Double-Bottom FormationThe chart shows forming a potential double bottom, a neckline (potential breakout level) appears around 123.20 SAR. A decisive break above this resistance is generally seen as the bullish trigger which could open 6–7% profit opportunity toward ~131.8 SAR Always manage risk in case the breakout stalls.

Double BottomDouble Bottom formed around 115 - 116.
Bullish Divergence on Daily TF.
However, to start its Bullish momentum, it
needs to cross & sustain 123 - 123.50
& if this level is Sustained, we may witness
130 - 131.
Stoploss in this case should be 114.70 on
Closing basis.

Nahdi medical will strongly continue its down trend Hello,
Dear investors, be aware if you still hold nahdi medical stocks, why:
- As it is shown on my chart we are still on the downtrend corridor
- It will go down until 103 wich is combined to bottom of this corridor and the 100% fiboo tool
what should you expect if you want to enter :
*As a buyer
- buy on the lower level(103)
- you invest more when it breaks up that corridor and specially when it go back to retest
this breakout.

**Al Nahdi Pharmacy Stock Review (Ticker: 4164): Promising 27% **Al Nahdi Pharmacy Stock Review (Ticker: 4164): Promising 27% Upside! 🌟**
Al Nahdi Pharmacy (4164) is an exciting buy, aiming for a **27% profit target** in the upcoming weeks! As a leading healthcare and retail pharmacy provider in the region, Al Nahdi benefits from a robust consumer base and growing demand for healthcare products and services, positioning it strongly for future growth.
**Key Drivers to Watch:**
- 🏥 **Healthcare Demand**: Rising healthcare needs are driving sales, with Al Nahdi at the forefront.
- 💰 **Growth Momentum**: Recent performance indicators suggest a solid upward trend.
- 📊 **Attractive Profit Potential**: A forecasted 27% gain presents a compelling opportunity for investors.
This stock could be a great addition to a growth-focused portfolio. However, ensure to stay updated on market conditions and set appropriate stop-loss levels for optimal risk management.

longBullish Divergence on Daily as well as Weekly TF.
If this week closing stays above 130, this would
be a positive sign.


4164Pull back from 0.5 (137 SAR) Fibonacci level is observed. Currently price is trading around 141.80 SAR. Resistance level lies around 151 from where selling can be expected. If is breaks and sustains then more upward can be expected. Use stop loss to manage risk below the support level of 137 SAR.

Nahdi### Key Points of a Falling Wedge
1. **Bullish Reversal Pattern**: Indicates a potential reversal from a downtrend to an uptrend.
2. **Converging Trend Lines**: Two downward-sloping lines that converge, connecting lower highs and lower lows.
3. **Volume Decreases**: Typically declines during the formation of the wedge, showing weakening bearish momentum.
4. **Breakout Confirmation**: A valid breakout occurs when the price moves above the upper trend line, ideally with increased volume.
5. **Trade Strategy**: Enter at the breakout, place a stop-loss below the lowest point of the wedge, and set a target price by adding the wedge's height to the breakout point.

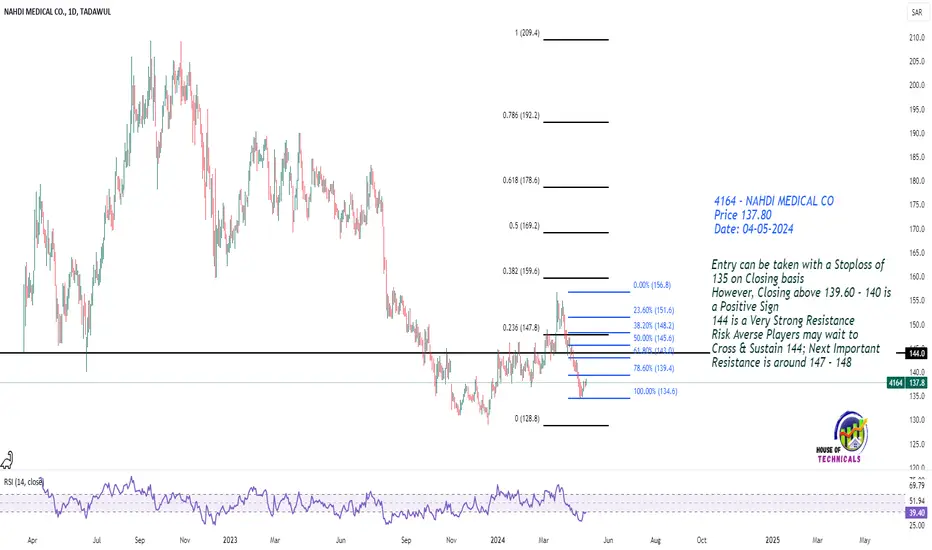
Long
Entry can be taken with a Stoploss of
135 on Closing basis
However, Closing above 139.60 - 140 is
a Positive Sign
144 is a Very Strong Resistance
Risk Averse Players may wait to
Cross & Sustain 144; Next Important
Resistance is around 147 - 148
Golden Pocket Support Expected
Entry can be taken with a Stoploss of
137 on Closing basis
However, Closing above 139.60 - 140 is
a Positive Sign
144 is a Very Strong Resistance
Risk Averse Players may wait to
Cross & Sustain 144; Next Important
Resistance is around 147

Nahdi to 200Alnahdi is targeting 200 long term
Alnadi is targeting 200 long term
Alnahdi is targeting 200 long term
Alnadi is targeting 200 long term
Alnahdi is targeting 200 long term
Alnadi is targeting 200 long term

NAHDI dropinga stormy volume comes here trying to pernitrate
this interesting level, probably a reverse of
wave will happen soon

Al Nahdi company The performance of Nahdi has been outstanding, showing a strong upward trend, which is reflected in the rising stock price. After analyzing the chart, I've identified key targets indicated by the red lines. To manage risk, I've set the stop loss at 140. This setup captures the growth momentum while safeguarding against potential downturns.

Nahdi Medical Breaks Out!!!Nahdi Medical Company’s major bullish breakout from consolidation phase this week brought in the highest trading volume daily since last 2023. Looking at this type of action, the first time volumes goes so high after so long, is indicative that a new market cycle is getting started. The super high volume is supported by a very, strong RSI.
Moving forward in 4164.
🎯 The first target is set at 159.8 for 8.32%.
🎯 Second target is set at 169.2 for 14.77%.
Now, the second target is not the end. . . We will see more growth, more profits, more fun in 2024 and beyond.
Thank you for reading.
If you boost, I know you enjoyed the content and I can continue to publish more.
Feel free to follow.
Thanks a lot for your support.
Assalam O Alikum.

ALNAHDI STILL UPThere is a potential to move up to complete the harmonic pattern. The stop loss is penetrating the red line down. So risk to profit ratio is very low.

The potential price action for Al Nahdi 4164 61This could be the potential price movement for AL Nahdi.
We still stage 4 as the way is paved towards high levels
in This stage (4) we have two scenarios
1- To reach 161.6 levels and retreat to lower lows 119
2- to reach 191.4 — motivated by the good news of the Q4 2023 — and start the natural correction to 161 levels for more rises.
All you need is to wait and divide your capital for all scenarios

4164 longAlnahdi is one of the biggest medical professionals pharmaceutical
Has a golden goal for long term investment

4164 (Nahdi Medical) to target 165 - And more!Daily chart, a pattern was formed, the target is 165
Stop loss at 132 or minimum the Green line.
RSI and MACD indicators are supporting the uptrend.
Above 165 for a week, the far target will be 214, passing through the shown resistance levels.
