4240 trade ideas

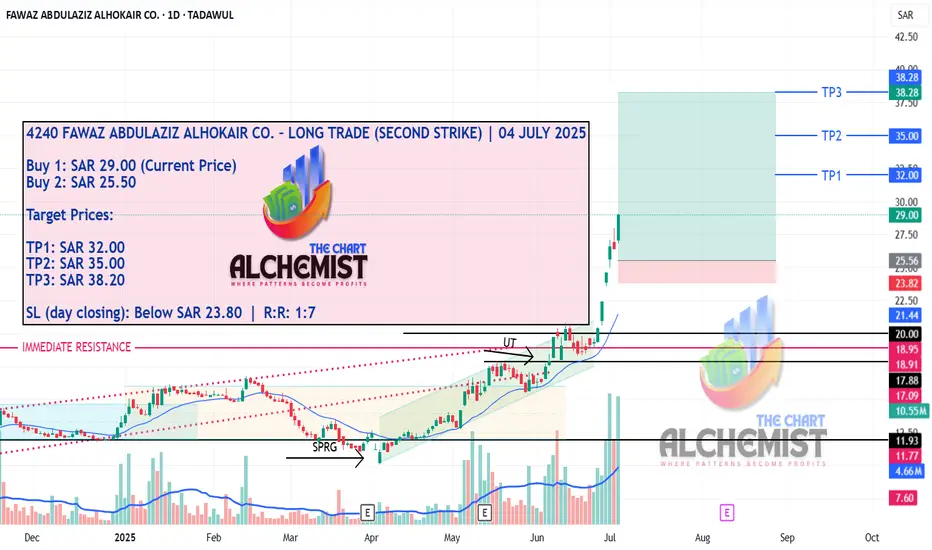
FAWAD ABDULAZIZ ALHOKAIR CO.–LONG TRADE (2nd STRIKE) 4/7/20254240 FAWAZ ABDULAZIZ ALHOKAIR CO. – LONG TRADE (SECOND STRIKE) | 04 JULY 2025
TADAWUL TRADE SIGNAL
After achieving all targets in our previous First Strike call, 4240 has now set up for a compelling Second Strike. The current price structure is showing strong continuation potential, with high-probability momentum likely to resume from this support zone. The risk-reward ratio remains highly favorable.
📌 Execution Strategy:
Caution: Please buy in 3 parts within the buying range. Close at least 50% of your position at TP1 and trail the stop loss to protect profits in case of unforeseen market conditions.
📢 Disclaimer: Do not copy or redistribute signals without prior consent or proper credit to The Chart Alchemist (TCA).
✨ Kindly support our efforts by boosting and sharing this idea!
Fawaz Abdulaziz Al Hokair Co 4240 January 2025Trading Setup Overview
Break of Structure (BOS): A strong move upward has likely broken a key structural resistance level.
Target: Equal highs (liquidity zones) are present above, which might act as magnets for price.
Bias: Keep this idea in view for a short-term bullish continuation unless a reversal pattern forms.

Falling Wedge Formation on Weekly TF.Falling Wedge Formation on Weekly TF.
Also, Breakout of Falling Wedge.
Immediate Resistance is around 19.30 - 19.50
& then around 22.
However, Long Term Target can be 60 - 61.
However, 10 should not be broken.

Fawaz Abdulaziz Alhokair 4240 Buying from Below Sell-side Liquidity
Entry:
Looking to buy from the Below Sell-side Liquidity.
Target:
Targeting a move towards Above Buy-side Liquidity at 18.94.
Analysis:
The setup is based on smart money concepts (SMC),(ICT) focusing on liquidity grabs. The sell-side liquidity, expected to act as a reaction point, with a strong potential for price reversal targeting buy-side liquidity levels above.

4240The AB=CD pattern is a popular harmonic pattern in technical analysis, used to identify potential reversals in the market. The bearish AB=CD pattern indicates a potential price reversal from an upward trend to a downward trend. Here's how it works and what to look for:
Components of the Bearish AB=CD Pattern
AB Leg: The initial upward move (AB).
BC Leg: A correction or retracement from the AB move (BC).
CD Leg: A continuation of the trend in the same direction as AB, ideally mirroring the length and duration of the AB leg (CD)

4240 Fawaz Abdulaziz al hukair4240 Fawaz Abdulaziz al hukair
takenout buyside liqudity
market structure shift
create fvg
brker
minimum equals highs is target.
taek your own risk.

Brief Review of 4240 Stock on the Saudi Stock Exchange
Investment Details:
- Stock: 4240 (Fawaz Abdul Aziz Al Hukair)
- Quantity: 2000 shares
- Purchase Price: 12.00 SAR
Review:
I recently invested in 4240 stock on the Saudi Stock Exchange, specifically in Fawaz Abdul Aziz Al Hukair. Initially, the investment seemed promising, with the stock priced at 12.00 SAR per share when I purchased 2000 shares.
However, my experience with this investment has been disappointing. Despite the initial optimism, the stock has consistently performed poorly, reaching an all-time low in liquidity. This lack of liquidity has made it difficult to execute trades efficiently and has significantly impacted the overall performance of the investment.
Overall, my experience with 4240 stock has been unsatisfactory, with the low liquidity and poor performance overshadowing any potential gains. I would advise caution to anyone considering investing in this stock until there are signs of improvement in its performance and liquidity on the exchange.

"weekly_monthly_peaks_and_troughs.js"// Weekly peak and trough indicator
function weekly_monthly_peaks_and_troughs(close, volume) {
// Calculate the weekly and monthly close prices
var weekly_close = close.resample("W").last();
var monthly_close = close.resample("M").last();
// Initialize the peak and trough arrays
var weekly_peaks = ;
var weekly_troughs = ;
var monthly_peaks = ;
var monthly_troughs = ;
// Loop through the data and find the weekly and monthly peaks and troughs
for (var i = 0; i < weekly_close.length; i++) {
// Find the weekly peak
if (i == 0 || weekly_close > weekly_close ) {
weekly_peaks.push(weekly_close );
}
// Find the weekly trough
if (i == 0 || weekly_close < weekly_close ) {
weekly_troughs.push(weekly_close );
}
// Find the monthly peak
if (i == 0 || monthly_close > monthly_close ) {
monthly_peaks.push(monthly_close );
}
// Find the monthly trough
if (i == 0 || monthly_close < monthly_close ) {
monthly_troughs.push(monthly_close );
}
}
// Return the peak and trough arrays
return {
weekly_peaks: weekly_peaks,
weekly_troughs: weekly_troughs,
monthly_peaks: monthly_peaks,
monthly_troughs: monthly_troughs,
};
}

Fawaz Alhokair stock analysis I still think that the stock is in a state of ups and downs, and the downside that we are witnessing is a corrective drop in proportion to the price explosion that occurred based on the correction and the analysis of the waves.

Fawaz is literally in a very critical area of corrective wave. Fawaz has almost hit the bottom of the support which was formerly a zone of demand and supply. Will wait and see how things go with FAWAZ.

Fawaz is temporary corrective to gain some momentum. Fawaz is very promising and has just formed a bullish flag as highlighted in yellow to continue his impulsive wave 5 of Wolfe.

4240 FAWAZ ALHOKAIR TO 33.85As per the chart:
-the downtrend is clearly broken at 17-Aug
-the price is showing support at 21.82
First target is 27.58 SAR
Second Target is 33.85 SAR
Stop Loss 20.07

Monthly bullish triangle - Alhokairan opportunity for long position
There is a gab around 20s SAR so I think if u don't care too much this is a good long position.


swing buy on a weekly basisStrong Buy Do not make a stop
will get you out of the market
The company's stock is placed in the portfolio
for medium-term investment

4240 -FAWAZ ALHOKAIR Stock is trading near to 52 week low.may test 52 week low and possible make new 52 week low.
past two days high volume with price downward movement ,it indicate stock may fall further.
if this stock trade above 16.14 for 3 hour s we may see some bullish movement . other wise 15.30 is support .
Relative strengh of this stock is 33 should be above 60 for bullish .
price recent support level 14.75 SAR .
better to avoid stock which is trading [ b]52 week low .


4240 it seems that it's going up for long termbased on the technical analysis, Weekly support the up trend as well.
