Weekly Buy Plan – TASI📈 Weekly Buy Plan – TASI
Context:
Price has made a deep pullback into a higher timeframe discount zone (highlighted in blue).
A sweep of 2024 low has occurred — clearing out liquidity and triggering a potential reversal.
After the sweep, price showed strong rejection and formed a Weekly Bullish F
About Tadawul All Shares Index
The Tadawul All Shares Index, or TASI, is a major stock index tracking the performance of all companies listed on the Saudi Stock Exchange (Tadawul). It was first compiled in 1985 with a base value of 1000. With top Saudi companies within its components, like Riyad Bank and Al Rajhi Bank, the TASI index provides a great view of the Saudi equities market — fast-growing and full of potential.
Related indices

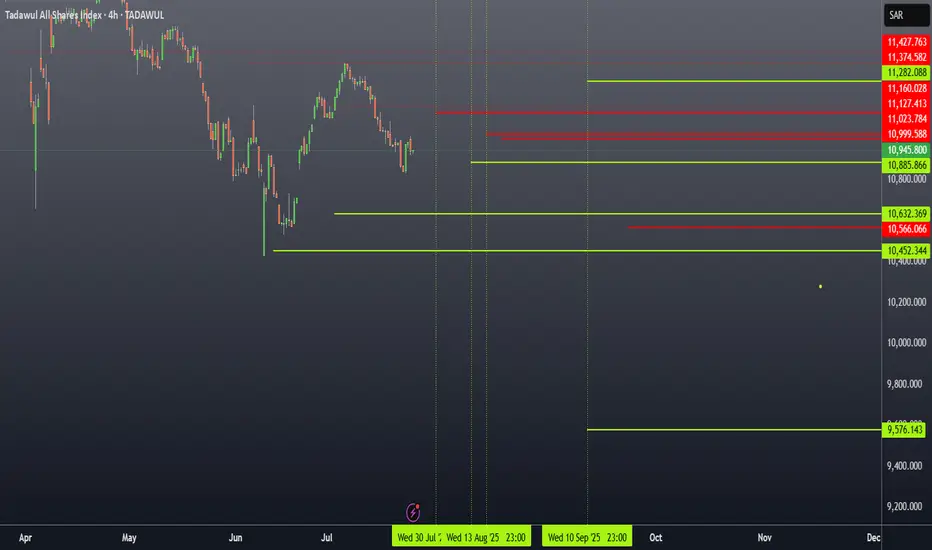
TASI Key Support & Resistance Levels This idea focuses on the Saudi Stock Market (TASI) key support and resistance levels based on time-sequenced price action.
Current support zone is highlighted (Point 1).
Time-based sequence:
🔺 Resistance on July 31 at 11126
🟢 Support on August 11 at 10885
🔺 Resistance on August 14 at 10999 / 10945

TASI Outlook: No Buy Until 11128 Break — Entry at 11282The Saudi market is currently resting on a support level, but the timing suggests we might see extended sideways movement before any significant trend resumes.
🚫 No buying positions should be considered unless the index breaks above 11128.
✅ A safer entry would be above 11282, confirming bullish mom
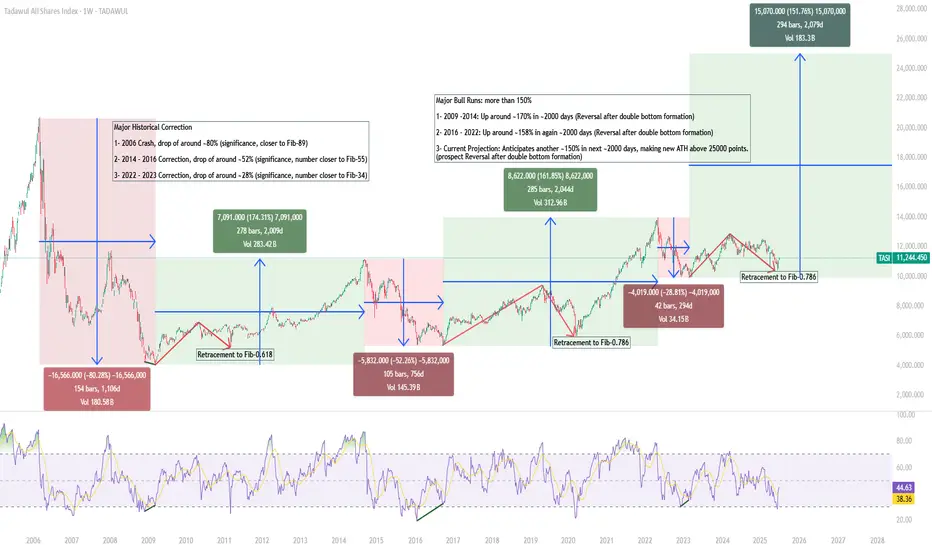
Is TASI poised to Break its ATHTASI is currently in the 11,000 range, there are historical patterns and fundamental economic drivers that incline towards a potential next rally that could set a new All-Time High.
Key Catalysts
Robust Government Spending
Kingdom's continued robust spending not only on mega-project is a key drive

TASI, looking for a nose divethe current geo political developments, the Index is looking for a dive towards 10,200- 9800 levels.
anything is possible, but based on the analysis, any push upwards is a desperate last breath before the dive. watch out.
This is not a financial advise at all. just what i see happening in the

Tasi is currently at a key support levelTasi is currently at a key support level that should not be broken. A break below the 10895 level would lead us into a downward trend.

TASI / Market Update: Bullish Signals Confirmed! 📈 Market Update: Bullish Signals Confirmed! 📈
The market has confirmed a solid bottom, and with God’s will, we won’t see lower lows! Here’s why we’re optimistic:
Strong Green Hammer Candle 🕯️: A clear bullish signal, showing the market’s rejection of further declines with conviction.
Bounce from Key

TASI Weekly Chart AnalysisFalse breakdown or trapdoor setup?
Saudi market bounces sharply off 200W MA + horizontal support. Classic Stage 3 to 2 retest in action?
•Massive bullish engulfing after shakeout
•Held key support zone near 11,100
•RSI rebounding from oversold territory
•Volume spike = institutional footprint
•Abov

TASI Weekly Chart AnalysisFalse breakdown or trapdoor setup?
Saudi market bounces sharply off 200W MA + horizontal support. Classic Stage 3 to 2 retest in action?
• Massive bullish engulfing after shakeout
• Held key support zone near 11,100
• RSI rebounding from oversold territory
• Volume spike = institutional footpri

See all ideas
Summarizing what the indicators are suggesting.
Oscillators
Neutral
SellBuy
Strong sellStrong buy
Strong sellSellNeutralBuyStrong buy
Oscillators
Neutral
SellBuy
Strong sellStrong buy
Strong sellSellNeutralBuyStrong buy
Summary
Neutral
SellBuy
Strong sellStrong buy
Strong sellSellNeutralBuyStrong buy
Summary
Neutral
SellBuy
Strong sellStrong buy
Strong sellSellNeutralBuyStrong buy
Summary
Neutral
SellBuy
Strong sellStrong buy
Strong sellSellNeutralBuyStrong buy
Moving Averages
Neutral
SellBuy
Strong sellStrong buy
Strong sellSellNeutralBuyStrong buy
Moving Averages
Neutral
SellBuy
Strong sellStrong buy
Strong sellSellNeutralBuyStrong buy
Displays a symbol's price movements over previous years to identify recurring trends.
Frequently Asked Questions
The current value of Tadawul All Shares Index is 10,946.830 SAR — it has fallen by −0.35% in the past 24 hours. Track the index more closely on the Tadawul All Shares Index chart.
Tadawul All Shares Index reached its highest quote on Feb 25, 2006 — 20,966.580 SAR. See more data on the Tadawul All Shares Index chart.
The lowest ever quote of Tadawul All Shares Index is 614.000 SAR. It was reached on Sep 11, 1986. See more data on the Tadawul All Shares Index chart.
Tadawul All Shares Index value has decreased by −0.79% in the past week, since last month it has shown a 0.57% increase, and over the year it's decreased by −9.48%. Keep track of all changes on the Tadawul All Shares Index chart.
The top companies of Tadawul All Shares Index are TADAWUL:2222, TADAWUL:1120, and TADAWUL:1180 — they can boast market cap of 1.55 T SAR, 101.46 B SAR, and 58.57 B SAR accordingly.
The highest-priced instruments on Tadawul All Shares Index are TADAWUL:7203, TADAWUL:2270, and TADAWUL:7202 — they'll cost you 918.00 SAR, 274.20 SAR, and 251.80 SAR accordingly.
The champion of Tadawul All Shares Index is TADAWUL:4240 — it's gained 279.28% over the year.
The weakest component of Tadawul All Shares Index is TADAWUL:8260 — it's lost −63.76% over the year.
Tadawul All Shares Index is just a number that lets you track performance of the instruments comprising the index, so you can't invest in it directly. But you can buy Tadawul All Shares Index futures or funds or invest in its components.
The Tadawul All Shares Index is comprised of 259 instruments including TADAWUL:2222, TADAWUL:1120, TADAWUL:1180 and others. See the full list of Tadawul All Shares Index components to find more opportunities.