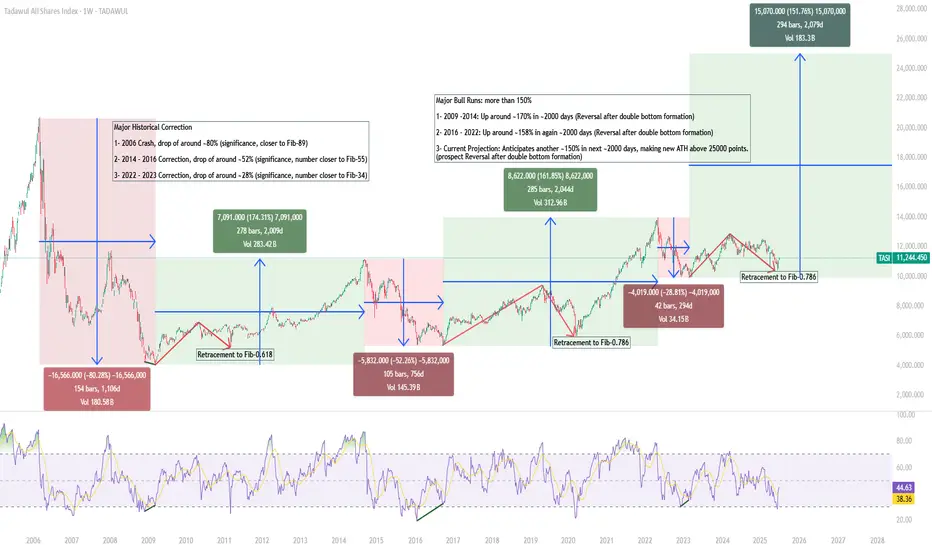
Is TASI poised to Break its ATHTASI is currently in the 11,000 range, there are historical patterns and fundamental economic drivers that incline towards a potential next rally that could set a new All-Time High.
Key Catalysts
Robust Government Spending
Kingdom's continued robust spending not only on mega-project is a key driver for economic growth
Non-Oil Sector Growth and Diversification
Continued growth in the non-oil sector and the Kingdom's diversification plans are vital for long-term sustainable growth, Kingdom is pouring significant resources into a range of cutting-edge technologies, (AI, Digital Infrastructure and Cloud Computing, Renewal Energy, EVs, Gaming and Entertainment.
Geopolitical Stability
Recent signs of easing geopolitical situation will strengthen investor confidence and lower further risks to market.
Technical Setups and Historical Data
On the charts, TASI shows possible upside trend based on historical and cyclic behavior, sooner breakout above 13000 will lead to all new ATH
TASI trade ideas

TASI, looking for a nose divethe current geo political developments, the Index is looking for a dive towards 10,200- 9800 levels.
anything is possible, but based on the analysis, any push upwards is a desperate last breath before the dive. watch out.
This is not a financial advise at all. just what i see happening in the market.

Tasi is currently at a key support levelTasi is currently at a key support level that should not be broken. A break below the 10895 level would lead us into a downward trend.

TASI / Market Update: Bullish Signals Confirmed! 📈 Market Update: Bullish Signals Confirmed! 📈
The market has confirmed a solid bottom, and with God’s will, we won’t see lower lows! Here’s why we’re optimistic:
Strong Green Hammer Candle 🕯️: A clear bullish signal, showing the market’s rejection of further declines with conviction.
Bounce from Key Support 🔼: The rebound from a well-tested support zone reinforces the strength of this move.
Market Indicators Shining 🌟: The average market index is flashing positive signals, indicating robust momentum.
Undervalued Stocks 💎: Most companies are sitting at their lows, presenting attractive opportunities for investors.
🚀 Key Level to Watch: A close above 12,065 points seals the bullish outlook, paving the way for further gains.

TASI Weekly Chart AnalysisFalse breakdown or trapdoor setup?
Saudi market bounces sharply off 200W MA + horizontal support. Classic Stage 3 to 2 retest in action?
•Massive bullish engulfing after shakeout
•Held key support zone near 11,100
•RSI rebounding from oversold territory
•Volume spike = institutional footprint
•Above 11,556? Stage 2 breakout confirmed
•Long-term target: 13,955+
Saudi bulls: Are you ready?
#TASI #Tadawul #SaudiStocks #TechnicalAnalysis #SwingTrading #MiddleEastMarkets #StockMarket

TASI Weekly Chart AnalysisFalse breakdown or trapdoor setup?
Saudi market bounces sharply off 200W MA + horizontal support. Classic Stage 3 to 2 retest in action?
• Massive bullish engulfing after shakeout
• Held key support zone near 11,100
• RSI rebounding from oversold territory
• Volume spike = institutional footprint
• Above 11,556? Stage 2 breakout confirmed
• Long-term target: 13,955+
Saudi bulls: Are you ready?
#TASI #Tadawul #SaudiStocks #TechnicalAnalysis #SwingTrading #MiddleEastMarkets #StockMarket

TASI, Saudi StockHello traders,
The last few days all stocks around the world move fast due to tariff.
Saudi stock is different than others, it looks strong, and it is a fantastic investment.
I see it goes up in the remaining days in april.
Symbol like
8200
1810
2090
2160
4070
4250
6010
8030
8180
8310
Good Luck for all

TasiTasi is in bearish mode.
Do not trade.
Downtrend is still to continue, the last two days were pause only, and opportunity to reduce the portfolios.

TASI Possible positive count for TASI
Don’t worry Over 10950 as long as it’s inside the upward channel
Sorry Arabic not supported to my account right now
I Wish the best for all traders and analysts


TASI Index W1 Scenario 1TASI Index W1 Scenario 1
We have 2 Scenarios both of them have same direction.
Regards.

TASISaudi stock market direction
i believe Our market will reach new high shaping wave 5 supporting by strong government and economic
not forget oil price and new vison 2023

BUY TASIAnd yes, here is the opportunity y'all been waiting for, you can buy TASI now and set your levels as set on my chart!
This is one of the 7 trades I shared to my cients, you can follow so whenever I drop the others you can take them!

TASI Weekly Outlook – Bullish Play in Progress!📈 TASI Weekly Outlook – Bullish Play in Progress! 💥
After forming a solid base around the Monthly Type 2 Zone, TASI is showing bullish signs of accumulation. We're now watching a potential explosive move toward the Context Target at 12,895.754 🚀.
The current structure suggests a short-term pullback before continuation—ideal for bulls waiting for a clean entry. Eyes on the prize as we aim for higher highs. 🔥
🧠 By: Asif Brain Wave

TASI IS PREPARING AN ENTRYAfter that TASI has taken the liquidity at 11,553, it just gave us an indication that it will start going bullish, no clean entry for now, but we'll keep waiting.
Meanwhile, my clients and I have taken other trades on 3 other stocks that are still in a safe zone, waiting for them to go higher so I can share them to the public.
As soon as I catch the entry and share it to my clients, I will share it to the public.
If you really care about taking clean entries, you must wait for the confirmation of the up movement then you can have a safe entry.
Follow for more!

TASI IS PREPARING A BULLISH MOVEMENTCouple days ago, I posted that TASI will come lower to 11,535.390, and here it is now on the level in which it will probably create us an entry to take to target higher levels.
Follow so you don't miss the future updates!

Different Time FramesMonthly View:
Monthly Support is around 11200 - 11500
Important Resistance is around 12500 -12700
Weekly View:
Weekly Closing above 12000 is Important for
touching the Resistance of 12500 - 12700.
Daily View:
Hidden Bullish Divergence has appeared which
is a positive sign.
If the Selling Pressure continues, we may expect a
bounce back from 11500 - 11600. Otherwise
today's Closing above 11820 can be a Positive Sign.

TASI IS GOING BEARISHAs you can notice on the chart, TASI as I told you in older posts, it grabbed the LQ at 12,302.190-12,333.861, gave us an entry point and now it is heading towards the level 11591.374 where it will grab the LQ.
For the people who have already bought, you can close and enjoy your profits, and for those who are willing to buy, the wise thing to do is hold your funds.
For further questions, don't hesitate to ask!
Follow for more!

$TASI | Bearish Retracement Play After Reaching Key TA TargetsTADAWUL:TASI | Bearish Retracement Play After Reaching Key Technical Targets
📉 Trade Setup:
I have entered a short position on TADAWUL:TASI based on fundamental analysis (FA), anticipating upcoming challenges in the financial system, which could pressure the stock market globally. Additionally, from a technical standpoint, the index has already met its key targets from $10K to $12.8K, signaling a potential retracement.
Trade Details:
🔹 Entry: 12,500
🔹 Stop Loss (SL): 12,550
🔹 Take Profit (TP) Levels:
• TP1 (30%) → 11,590
• TP2 (20%) → 11,325
• TP3 (20%) → 10,990
• TP4 (30%) → 10,030
Technical & Fundamental Outlook:
• The market has extended significantly from $10K to $12.8K, reaching exhaustion zones.
• Economic uncertainty and potential systemic challenges could trigger a market correction.
• Expecting TADAWUL:TASI to retrace and mirror the prior upward move.
📊 Risk Management:
• Tight SL at 12,550 ensures controlled risk.
• Profit-taking at multiple levels to lock in gains progressively.
📝 Thoughts? Drop your insights below! 🚀📉

TASI Daily (Wave Analysis)TASI Daily (Wave Analysis)
please see the weekly analysis wave and volume in my profile
regards,

Morning Star formation Morning Star formation on Weekly TF which is
actually a positive sign.
However, sideways channel is there on Daily TF.
Crossing 12430 may lead it towards 12700 - 12780 initially
& then towards 13870 - 13997.
Also, 0.618 has been tested of the recent rally.
13211 is a Very Strong Resistance that if Crossed
& Sustained will expose New Highs towards
16500 & 17800.

UPDATE ON TASIA month ago, I posted that TASI will continue going lower to reach 11,439.529, and it came up the grab the LQ at 12182.412 now it will continue lower.
Again this movements fooled some people and bought higher now they're in losses and looking for how to recover.
Don't buy TASI now, wait for it to quit the consolidation level then you can buy.
Follow for more!
