WAR what is good for ? Absolutely profit say it again. #SAUDI stock market chart.
On the Day that the UK government has authorised military strikes against Yemen.
I take a quick glance at the Saudi stock and see a #HVF in progress.
Saudia Arabia as version of the #UAE, as it reinvents itself
is the investment thesis,
if your morals allow.
We can get upset about geopolitics
But the war machines are powerful and keep grinding...
at least put you and your family in a better position financially is the most practical path for us to take on a personal level.
@TheCryptoSniper
#HVF
TASI trade ideas

TASI - Long TermRegarding the analysis of the Saudi TASI index, we observe the activation of the Bat harmonic pattern targeting 13500, and it is expected to evolve later in the long term to form the Crab pattern at 16420.
Good Luck.

TASI to target 13930Weekly chart, the Saudi TASI index has formed a chart pattern W and V, then the target is 13930
Expected time frame 3rd Q 2024
Technical indicator MACD is positive; RSI is near over-bought zone.
For the long term, monthly chart, there is a probable target at 18100
Good Luck for the Saudi Market :)

Tasi - Bullish Signs Show some good signs:
1- 200 moving average breakout
2- level 11159.5 break
If price continue up move
target will be:
TP1: 11933 level

Either break or reject The Tadawul All Shares Index (TASI) closed the latest weekly session at 11,225.35 , marking a positive gain of 47.87 points (0.43%) . Currently, the index is testing desending trend line. The index shows low activity with a small candle body which indicated rejection can be seen in upcoming sessions. A bearish pattern is evident until the 10,400 support sustains. The weekly RSI stands at 53.84, while the MACD signals a weak bearish trend, poised for a bearish shift.

Tasi - Correction Signs Show some weak signs:
1- Break VAWAP
2- Bearish Divergence
back to retest 200 Ma or deep correction to 10504
target will be:
TP1: 11159
TP2: Daily 200MA

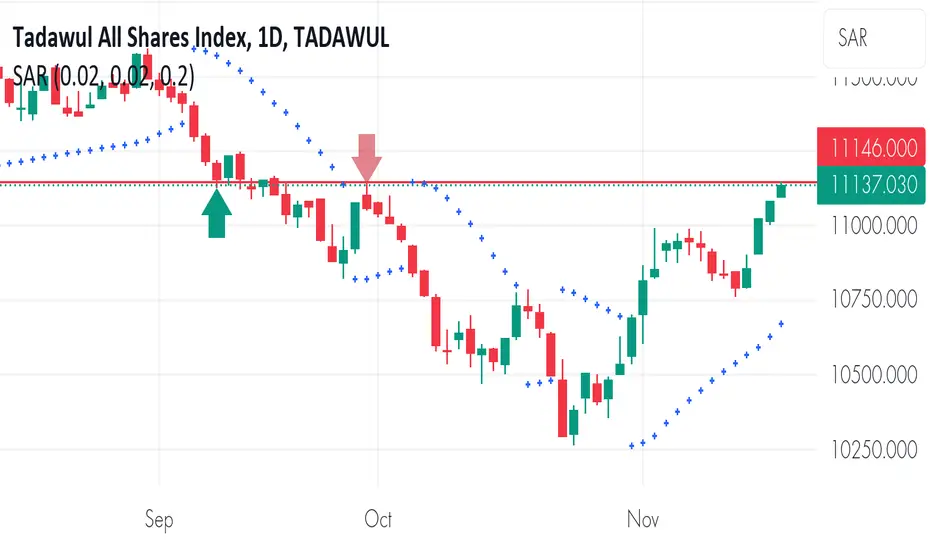
TASI bullish momentum continuation The Tadawul All Shares Index (TASI) concluded its most recent trading session at 11,137, reflecting a positive gain of 55 points. Notably, the index has surpassed its previous resistance level of 10,987, which has now transitioned into a crucial support level. The subsequent resistance level is anticipated to manifest around 11,189 which the market almost tested in the last trading session. Current market patterns imply a potential upward momentum, contingent upon the index maintaining its support level at 10,987. This sentiment is reinforced by the parabolic SAR, which signals an upward trend in the market.
*Market Summery*
Close: 11,137
Change: +55
Volume(mln): 260
RSI: 66
High: 11,145
Low: 11,091
*Pivots*
R-3: 11,513
R-2: 11,298
R-1: 11,189
PP: 10,974
S-1: 10,866
S-2: 10,650
S-3: 10,543
long for long time, TASI. The main stock market index in Saudi Arabia (TASI) increased 604 points or 5.76% since the beginning of 2023, according to trading on a contract for difference (CFD) that tracks this benchmark index from Saudi Arabia.

TASI_ Wait for Support BreakoutTASI has been in correction for a while
A trendline breakout is observed recently (with Formation of HH) which gave a short positive upside movement.
Formation of HL in progress
11,000 is a significant resistance line
Bulls need to break the resistance line for upside movement.
Watch for individual stocks for proper entry

TASI - Tadawual All Shares Index - Saudi stocks TASI
ALsalam 3alikom, I hope you are fine!
Study the TASI graph, which depicts Daily for short time. When initially looking at the chart, you should be able to immediately identify broad details, minor details and minute details.
The minor details in this chart are also quite easy to identify, which is lines respect All level of Fibonacci extension. The minute details are those points in the graph where change occurs, which back and respect the level of 2.618 Fibonacci extension, after that we have a Manipulation between 2.618 and 2 levels, which fluctuate and respect daily FVG.
On overall I would dramatically entry to the line because Break the Liquidity Grap ($) and
we have the nice - Sell Side imbalance buy side influence - "SIBI" and the target is 3.618 level
Vocabulary:
- Fibonacci Expansion is a charting technique used to plot possible levels of support and resistance by tracking not only the primary trend but also the retracement.
- Sell Side imbalance buy side influence - "SIBI"
Liquidity Grab ($) Liquidity refers to how active a market is. It is determined by how many traders are actively trading and the total volume they're trading.

TASI follow up in arabic 5 Novfollow up in TASI and past and future interest area and probable future behaviour

tasi uptasi up. correction finished. new target is 12000.
The impact is not only felt on the Tadawul All Share Index but also on the broader MSCI GCC Countries Combined Index, which has declined by 6% in 2023. Saudi banks, which make up 36% of the Tadawul, are grappling with these high interest rates. The increased rates are affecting credit demand and driving up the costs of debt refinancing.

A new impulse in TADAWUl (SAUDI ARABIA)The Saudi Arabian Tadawul All Market index moved up in an impulsive wave 1 in march 2023.
The index has however seen sharp correction from July 2023 till date.
after having retraced almost 70% from the wave 1 high the index is now look to scale up slowly eventually into wave 3 towards 12-12.5K mark.

TASI 1st H&S played out nicely.
2nd H&S did too.
I believe more pain to come.. Equal lows below, liquidity to be grabbed + an open gap (purple box).
let those play out then i'll consider longing

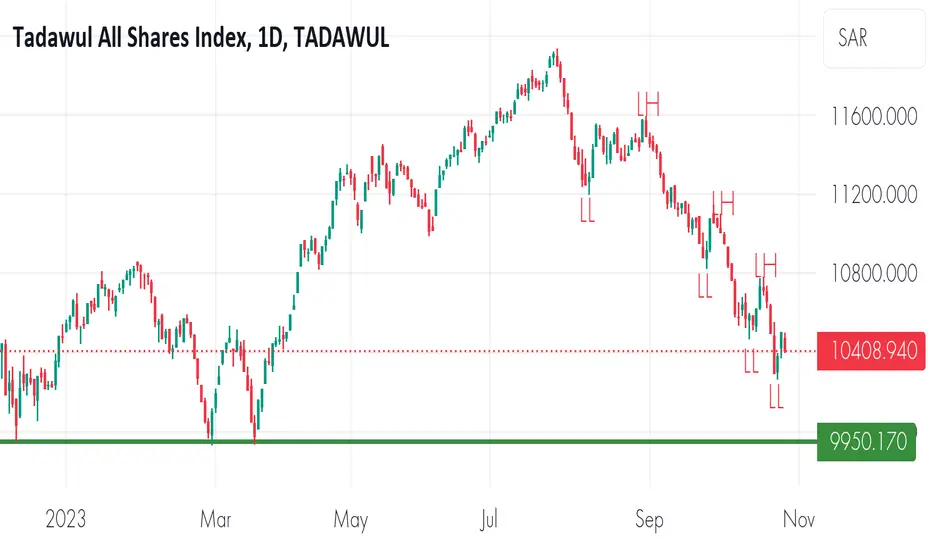
TASI down trend continuesThe Tadawul All Shares Index, or TASI, is currently trading around 10,408. The current pattern suggests that the index is in a down trend, making lower lows and lower highs, notable support is around 9,950. If selling pressure minimize and sustains the support level, pull back is expected.
$Tasi at potential bounce areaTasi is at a potential bounce area, this is a zone of multiple support clusters
Even if the downtrend will continue, a reaction to the up side from here is highly expected

Task.....4h=Analysis of the Saudi TASI index.
= Analysis on the quarter-hour time frame
= The analysis is based on trend analysis
= He successfully overtook the decline of an ascending trend line
= The decline aims to reach level 9961

TASI has a promising opportunity Dear supporters
I got a lot of request to analyze the Saudi Index TASI, here we are.
most of the stocks now at the accumulations phase and I see a very good investments and trading opportunity.
good luck every one


TASITADAWUL:TASI
I believe the price movement of the Saudi stock index will move in this direction in the medium term

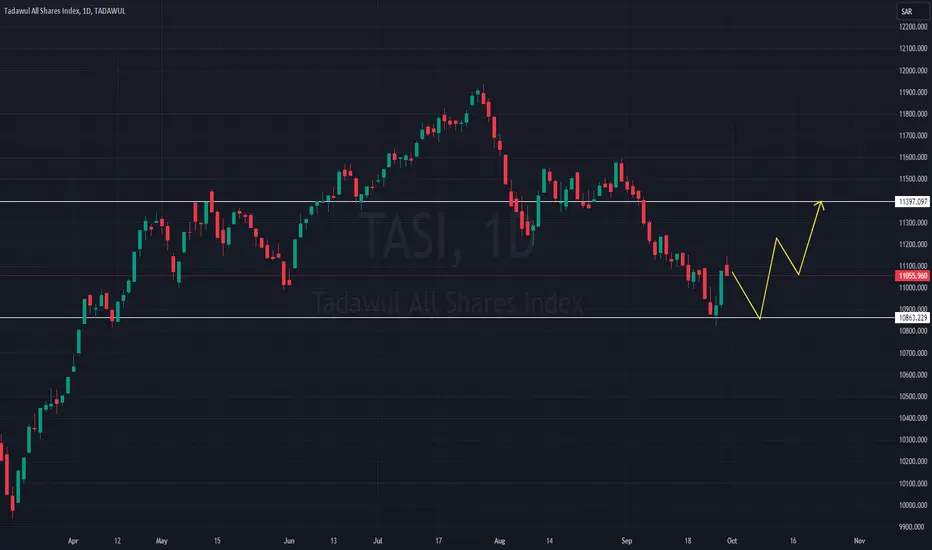
One more bounceThere are good chances it may revisit the support area 10860 zone then we may see fresh buyers coming it to catch the bottom. Next strong area of resistance is 11400 zone if that is taken out then we may see new highs in TASI soon.
With oil prices climbing up Saudi Stocks will see good push and will attract more investor. If you want more updated on Saudi Market then hit LIKE & follow.
Tasi date of 16/10 is crucial for the current waveSupport and resistance levels are critical elements in guiding market trends, and in the TASI index, they play a vital role. The level of 10955 is considered primary and significant daily support, and closing below it represents a sensitive trading zone. On the other hand, 10522 is a major support level that requires careful monitoring, as it could potentially serve as a turning point for the price pattern if it successfully tests this resistance.
If the region around 10412 is breached and there's a weekly or monthly close below this level, it could signal that the market has entered a risky zone, potentially leading to further downward movement. Therefore, it's essential to closely monitor this level.
Finally, the date of 16/10 is crucial for the current wave, as it may bring significant developments to the market. It is advisable to ensure that this date is marked on the economic calendar and included in technical analysis to track important events that could impact financial markets.

