TASI Weekly ChartTadawul TASI Weekly chart with major pivots.
Each blue line is 45 degrees from HL to major HH.
H. Numbers are thirds numbers between angles.
TASI trade ideas

TASI.....H= Analysis of the Saudi General Index (TASI)...
= Analysis on the hourly time frame
=The analysis is based on the classical school of analysis
= We now have a falling continuation wedge pattern
= When it breaks the level 11439.335, it becomes eligible to drop to the level 11356.639
= By breaking this level, it becomes eligible to reach level 11243.334

TASITASI is still around the bear market level with the possibility of a move slightly higher before continuing to the down, let's see how it will play

33% upside opportunity for Retal 33% upside + 2.23% dividends. Since Retal has already declared 0.16 for the first half and it is company policy to issue a dividend on a half-yearly basis

TASI.....H= Analysis of the Saudi general index, based on the hourly chart
= The analysis is based on the school of classical analysis
= Form an inflection triangle
= breaching the level of 11486.108 pushes the stock to reach the level of 11529.540
= A breach of the level of 11529.540 pushes the price to 11694.359

TASI follow up 22 Aughello there ....
TASI now in undecided status we need TASI to show up some strength otherwise any break or 1 will give a chance to move to the next area No.2 if break the will give a chance to move to No.3 box where we found cluster of Fib in large and small time fames.
this just to share what i have learned and need your assessment and comment to further my knowledge.

TASI ALsalam 3alikom, I hope you are fine!
Study the TASI graph, which depicts weekly for all SAUDI stocks. When initially looking at the chart, you should be able to immediately identify broad details, minor details and minute details.
The minor details in this chart are also quite easy to identify, which is lines respect 0.5 OTE Fibonacci. The minute details are those points in the graph where change occurs, which back and respect the order block and 0.5 OTE Fibonacci, which describe the rising wedge pattern.
On overall I would waiting the line to the 0.62 and respect the Weekly - Fair Value Gap (FVG) to Entry and my profit which the old order block on 0.62 Fibo
Vocabulary:
- A rising wedge is a technical indicator, suggesting a reversal pattern frequently seen in bear markets. This pattern shows up in charts when the price moves upward with pivot highs and lows converging toward a single point known as the apex.
- OTE refers to an order that is placed by a trader with the intention of executing a trade at a specific price. In other words, it is an instruction to a broker to execute a trade at a predetermined price level.

TASI"No liquidity sweep, no entry. Market structures can change at any time. Every candle contains liquidity. Price always requires liquidity. The direction of price movement is unpredictable. Hello traders, here is the analysis. If you find my analysis helpful, please hit the like button and consider following. Thank you.
Concept of Smart Money: Identify liquidity or become liquidity.
DISCLAIMER: This content does not constitute financial advice."

Tadawul All Shares Index Weekly AnalysisAfter change of character and break of structure and rejection of the Golden Zone Fibonacci 50% and 60% and fill FVG '' Fare Value Gap '" in this zone we will see a contuniation of up trend to fill FVG of down trend and take liquidity of the buy side

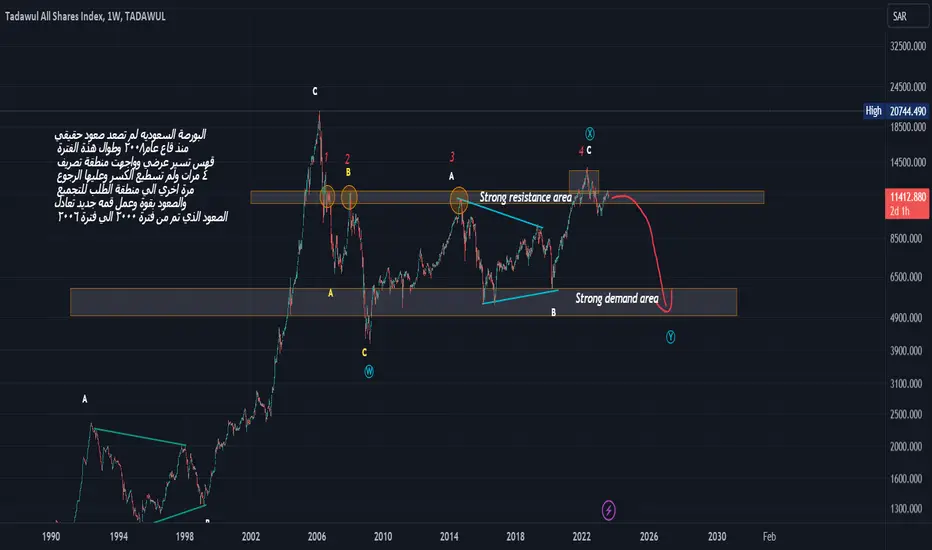
TASIThe Saudi Stock Exchange has not gone up a real rise since the bottom of 2008, and throughout this period it is moving horizontally and faced a drainage area 4 times and could not break it, and it must return again to the demand area to collect and rise strongly and make a new peak equivalent to the rise that took place from the period 2000 to the period 2006
Please clarify that I am helping you with my point of view, which may be right or wrong, and see my previous analyzes of many currencies and forex in order to judge the owner of this analysis with a more accurate look
Good luck
TASI raising wedge target
Hello there..
in this chart in draw TASI raising wedge and its target one of the Classic chart pattern hope you find it helpful.

TASI FOLLOW UP 9 AUG just an idea about TASI future points of interest where i put my knowledge to test hope very one find it helpful and plz if there any thing i missed or i am wrong about

🔴 TASI 🔴NO LIQUDITY SWEAP NO ENTRY.
STRUCTURE IS CHANGING ANYTIME.
EVERY CANDLE HAS LIQUIDITY.
PRICE ALWAYS NEED LIQUIDITY.
Nobody Knows Where is Price Going.
Hey traders, here is the analysi.
If you guys like my analysis please hit like?? and follow.
Thanks.
SMART MONEY CONCEPT.
identify Liquidity Or Become Liquidity
DISCLAIMER- This is not financial advice.

TASI FOLLOW UP 8 AUGjust an idea about TASI future points of interest where i put my knowledge to test hope very one find it helpful and plz if there any thing i missed or i am wrong about

TASI daily follow up just an idea about TASI future points of interest where i put my knowledge to test hope very one find it helpful and plz if there any thing i missed or i am wrong about

TASI follow up wave 4 correction hi there this is follow for yester day video and extra explanation of Wyckoff theory in markets hope every one find helpful and looking forward to your comments and information so we learn form each other ....

Technical and digital analysisWe notice that we are in an upward correction, there is an increase in the buying momentum, and that the price is in a strong correction, and we have a divergence

just an idea about TASI future points of interest just an idea about TASI future points of interest where i put my knowledge to test hope very one find it helpful and plz if there any thing i missed or i am wrong about

Get ReadyTasi is been falling non stop, but for now its at a very crucial support zone, most likely we should see a bounce from here and resume its uptrend.
Hit like & follow guys;)

the Saudi market index, TASIA possible rebound area for the Saudi market index, TASI, as the current area is a support area, as it is noted that the index respects Fibo levels, and the index is expected to rise again in the coming days.

#TASIHello my friends, this is TASI analysis, and this is what I learned from technical analysis. My opinion is that it is bouncing up from the green balloon area, and the targets are clear.

Task......4h= Analysis of the Saudi general index, the Tasi
= The analysis is based on technical analysis of the trend and price channels.
= The price crossed an ascending channel
= It is expected to reach the level of 11398.667, and when it reaches this level, it will make a correction or a horizontal path, and when it breaks it, it will go down to touch the level of 11032.137

TASI BUYthere is wonderful investment opportunity on tasi stock ; there is a strong breach of the downtrend a restest of the area and a bounce from it with a correction on the same area fiboacci 50 YOU CAN SEE MY ANALYSIS MY PAGE
