TASI to make slight correction and then uptrendTASI
Saudi Tadawul Index
On the daily chart, having a resistance level as technical indicator RSI is being overbought, and applying Fibonacci retracement, the index is likely to correct either 23% (11550) or 38% (11460), then rebound.
The next up wave will be begin after crossing up 11750, to target 12100
Note: The weekly and monthly charts are showing positive up potential.
TASI trade ideas

TASITASI is struggling to beat the 11600 Mark in weekly chart.If it doesn't break within a week, a profit booking is likely anticipated.

TASIEVERY CANDLE HAS LIQUIDITY.
PRICE ALWAYS NEED LIQUIDITY.
Nobody Knows Where is Price Going.
Hey traders, here is the analysi.
If you guys like my analysis please hit like?? and follow.
Thanks.
DISCLAIMER- This is not financial advice.
SMART MONEY CONCEPT.
identify Liquidity Or Become Liquidity

TASINobody Knows Where is Price Going.
Hey traders, here is the analysi.
If you guys like my analysis please hit like?? and follow.
Thanks.
DISCLAIMER- This is not financial advice.
SMART MONEY CONCEPT.
identify Liquidity Or Become Liquidity

TASI WEEKLY ANALYSIS after the creation of engulfing candle we will see a continuation of uptrend towards supply zone

TASINobody Knows Where is Price Going.
Hey traders, here is the analysi.
If you guys like my analysis please hit like?? and follow.
Thanks.
DISCLAIMER- This is not financial advice.
SMART MONEY CONCEPT.
identify Liquidity Or Become Liquidity

Tadawul All Shares IndexTADAWUL:TASI
Tadawul All Shares Index
The general index of the Saudi market has come down and we have already identified the areas of demand and we said on Twitter that it will go up when it trades in and so on

full analysis TASIThe last wave to close is expected to rise, including a decline again to test the bottom of wave A
TASI (Weekly Bearish)Weekly H&S
Currently re-testin the neck-line
doubtful it will break through to the upside.
I wouldn't short tho.. just my observation

view on TASITASI is bearish for the short term ,
that is not signal , it is just my view
what is your view for tasi ?
share your view .

TASINobody Knows Where is Price Going.
Hey traders, here is the analysi.
If you guys like my analysis please hit like?? and follow.
Thanks.
DISCLAIMER- This is not financial advice.
SMART MONEY CONCEPT.
identify Liquidity Or Become Liquidity

tasi, approaching a strong resistance levelWill he penetrate or turn back? ... I await your opinions
((Everything I write is a point of view that accepts right and wrong and is not considered buying or selling advice...just for discussion)).

TasiTADAWUL:TASI
Draw a prediction chart for the Saudi stock market index until May 29th, and predict the market movement on an hourly time frame."


TADAWUL Support/ResistanceTadawul bounced back after touching S3 level and currently trading in range.

TASITADAWUL:TASI
Draw a prediction chart for the Saudi stock market index until April 27th, and predict the market movement on an hourly time frame."

TASI targets as you can see the large pattern over a long period since 2006 is in an uptrend direction and the 1st target between
11465-11939. if it can't break this and closes above it will go back again to 9930 otherwise all indicators and pattern says the long target will be between 17000-19000 over 2 years on December 2024-2025
this is just the opinion of the writer and it is not advisable to sell or buy

TASI how to trade the downtrend in TadawulSaudi stock market, also known as Tadawul, is the largest in the Middle East, and it has been in spotlight due to various economic reforms aimed at diversifying the country's economy and reducing its reliance on oil exports. The government's Vision 2030 plan includes initiatives to attract foreign investment, develop non-oil sectors, and privatize state-owned companies, which could contribute to the growth of the stock market.
Technical analysis:
- TASI has enjoyed a bull run to reach highs of 14,000 in May-22 from the Covid lows of 5,600 in Mar-20
- It is in downtrend since last 10 months and next support level is pre-Covid peak of May-19 at 9,386
- On daily timeframe, 200 DMA support is broken and price is headed downwards
- Volume is below average
- Negative directional movement
Strategy:
Price is trading in descending channel. Below strategies can be useful:
- Sell the top of channel
- Buy at the bottom of channel
- Buy if the price breakouts above the channel
Recommendation: SELL

TASI index very close to 200 DMASaudi Tadawul All Shares Index is in a downtrend about to touch 200 DMA
We will watch for a bounce at weekly 200 DMA

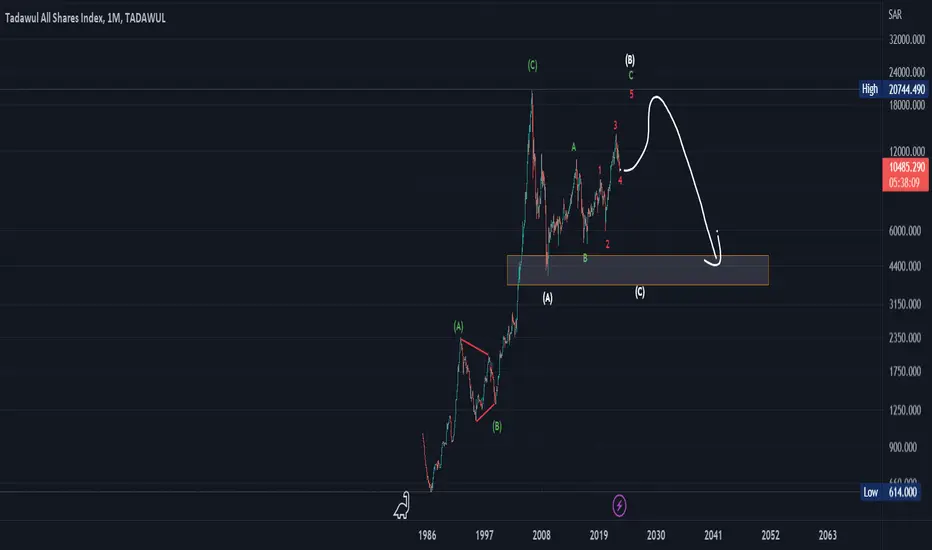
Long Term TASI OverviewTasi is currently retracting to the flip zone that it broke through during the COVID phase. With the bullish hidden divergence between A and C lows, the Saudi market is getting ready for a huge run towards the 30k levels to complete this Crab Harmonic pattern.

My expectation of TASI , Saudi Index TASI, targeting 9468 next couple of weeks if the MA 90 not passed up today. But the close still above RSI in the chart.

TADAWUL ALL SHARES INDEXHello ladies and gentlemen, I think the time has come to buy.
TASI to 13800 SAR.
if you have any questions do not hesitate to contact me.

Tasi It's still an uptrend Tasi
It's still an uptrend
I expect the success of the bottom test and the completion of the path
