Tasi hello Traders
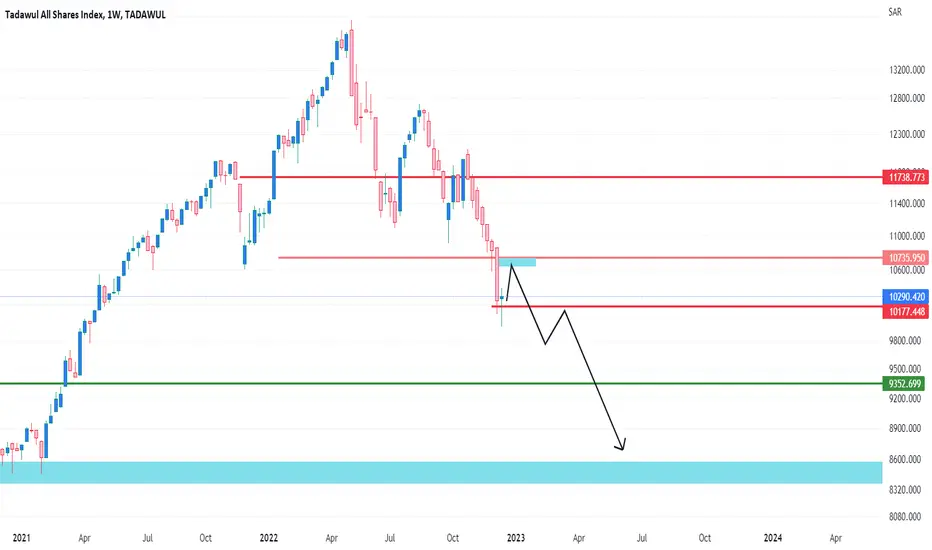
The general trend of Tasi index is bearish, and I think it will continue until the end of the year (and during that downward journey, there will be speculative retracement waves.
Tasi heading to down so remember to Buy good balance sheets. Sell bad balance sheets.
thanks
TASI trade ideas


TASI (Macro View)TASI on monthly/weekly time frame shows a huge potential
Ranging in Triangle with Breakout in Early 2021, price is about to retest for further upward movement
Confluencing with fundamental potentials of Vision 2030.
Government focus on Vision 2030 generates a wide range of economic reforms, creating new business opportunities, driving economic growth and diversification.
Private investment plays an essential role in realizing Vision 2030. Saudi Arabia aims to achieve
40% to 65% increase in private sector contribution to GDP
0.7% to 5.7% increase in FDI’s contribution to GDP by 2030

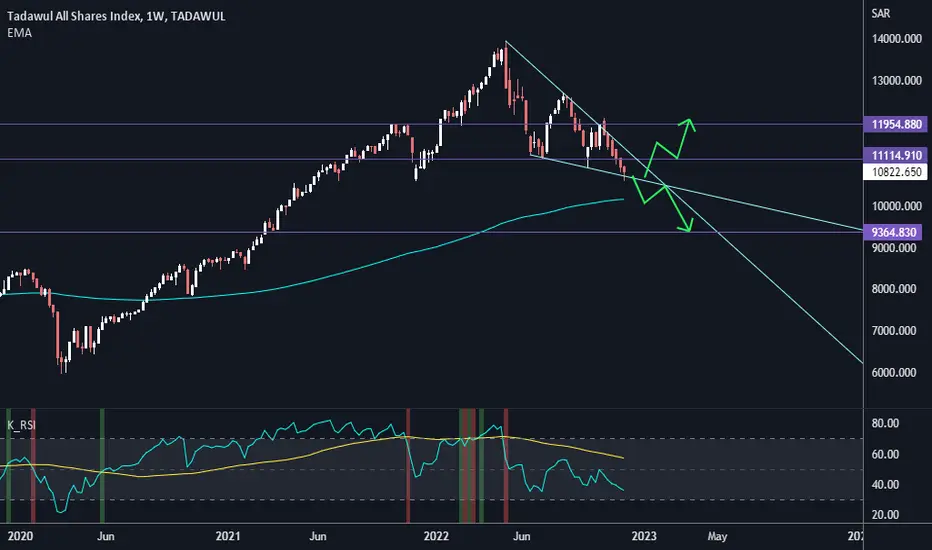
TASI Tadawul All Shares IndexTASI is beautifully following Falling Wedge Pattern.
Bearish Until End of Nov
Short Bullish retracement within Falling wedge is expected by End of November Until top of falling wedge (in further 4 weeks).
Trade individual stocks with proper stop loss
Expected Bearish until Watchout level at strong support

How Saudi Stock Market Sectors Performed During 2022?The chart illustrates how the Saudi stock market performed by sector in 2022, according to several indices of TADAWUL exchange:
• TASI: All Share Index (-7.53%)
• TBNI: Banks (-6.60%)
• TMTI: Materials (-14.34%)
• TTSI: Telecommunication (-11.57%)
• TENI: Energy (-1.02%)
• TISI: Insurance (-11.58%)
• TSSI: Software & Services (+21.63%)
• TRMI: Real Estate Mgmt & Dev't (-22.18%)
• TFBI: Food & Beverages (-3.75%)
• THEI: Health Care Equipment & Svc (+24.34%)
The percentage on the right represents the year-to-date performance.

TASI: Short due to uncertainty and liquidityWith the recent cash grab of Al Rajhi Bank Sukuk completed the issuance of SR10 billion ($2.6 billion) Tier 1 SR-denominated sukuk, with coverage of over 300%. Saudi Arabia’s main index TASI is suffering liquidity in the market.
TADAWUL:TASI
DATE VALUE TRADED (SAR)
2022/12/15 6,702,114,194.93
2022/12/14 5,198,452,452.29
2022/12/13 5,641,471,939.41
2022/12/12 5,944,166,488.26
2022/12/11 3,054,604,600.67
2022/12/08 4,207,197,978.96
2022/12/07 3,681,126,174.09
2022/12/06 4,967,970,943.47
2022/12/05 4,146,969,817.51
2022/12/04 2,909,780,131.80
TASI which is heavily weighted by the Banking and Petrochemicals;
$2222 is currently below its IPO price of 32 – Lately facing pressure of uncertainty of Oil Prices and demand.
$7010 With the recent buybacks it appears that the company is signalling a slight uptrend in the telecommunication sector.
$2010 The company’s recent financials have been hit with net profits margin sank to 3.92% compared to its previous quarter of 14.1%. Additionally, SABIC’s profits deteriorated over 67 percent from SR5.6 billion in the same quarter a year earlier, recording a bigger fall than analysts had earlier estimated, despite a revenue jump of 7 percent to SR47 billion.
$1120 $1180 Both SNB and Al Rajhi are showing robust fundamentals due to the recent macroeconomics although if a recession were to happen in the upcoming months loan demand declines and investors seek safety.
References: Aljazira Capital, Argaam

tasi road map 2030 road map to tasi the 5th leg will target the the hisorical high a good opportunity to long

TASI dumping to 8k rangeOur loving but always dropping TASI will continue down to 8400-8800 for several reasons.
1- The macro market. (Mainly)
2- It's broken down a major and well-defined trendline since 2008 and shows signs of rejection. Bears are in control at this point in time.
3- All major long term fib lines align at this point.
4- An order block (weekly) that followed the recovery of the market after the COVID crash was formed but was never retested as of yet.
Should the macro market continue to deteriorate, there is a major trendline at the 7000 range to hold us up. Breaking any further than than, let's say to the 5600-6000 range, is a fire sale 🔥 🔥
Well that's most of the bad news. There will be good trading days that will follow. Just stay focused on growing your capital legends. So when the bottom of the market truly arrives, we will have the power to invest for the long term. Take care.

TASI next 2 weeks This scenario is expected in the next 2 weeks BUT most markets are down which might put some pressure on TASI.

TASI The market opens green, we will see the market recover a bit, then we will see new levels, see the chart

Bears are controlling the trendThe chart shows the uptrend starting date and shows that the bears are controlling the market with final expected target for the bears @ 8550.

Tadawul All Share Index (TASI) look for coming weeksTadawul All Share Index (TASI) at a crossroads:
1- rise to nearly 12000
2- down to 9500 level
Seasonals on TASICyclic Analysis:
2002-2022- November's cndle is red 11x.
8 out of 11 times, the month of
december showed green candle (Bullish)
Others supporting Bullish reversal:
1- double bottom candle formation
2- formation of HL at strong support

TasiPossible expectation of a TASI correction during the coming period... In general, the upcoming bullish wave is a correction wave..
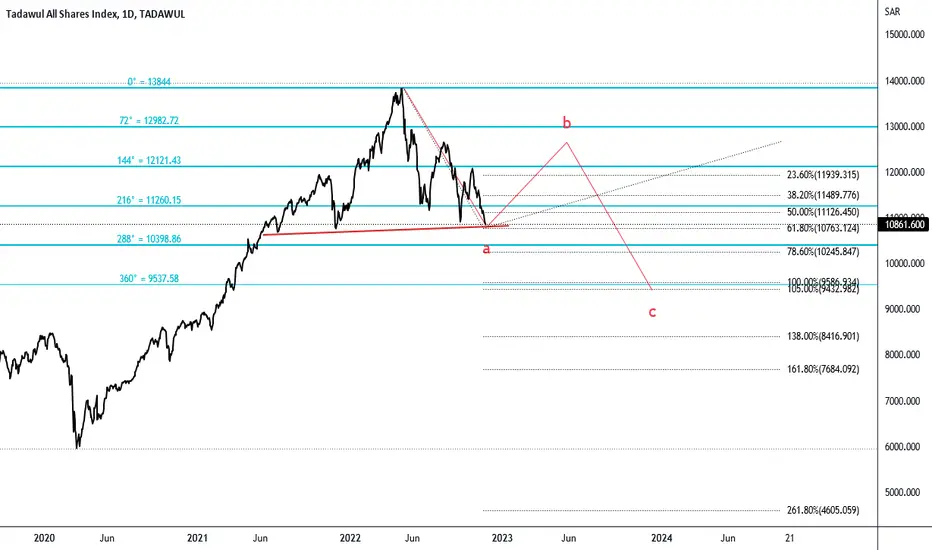


TASI Tadawul All Shares Index
Since Covid Bottom Level, market has taken 135% Bullish Rally until May 2022.
It has taken correction up to 22%.
It may retrace from any fib level.
H&S formation is complete and correction may lead to it's target.
However, a strong horizontal support will be help retracement.

tasi is on the way for the harmonic and Elliot targets lets follow Saudi markets, its going south for the time being
I will update them regularly

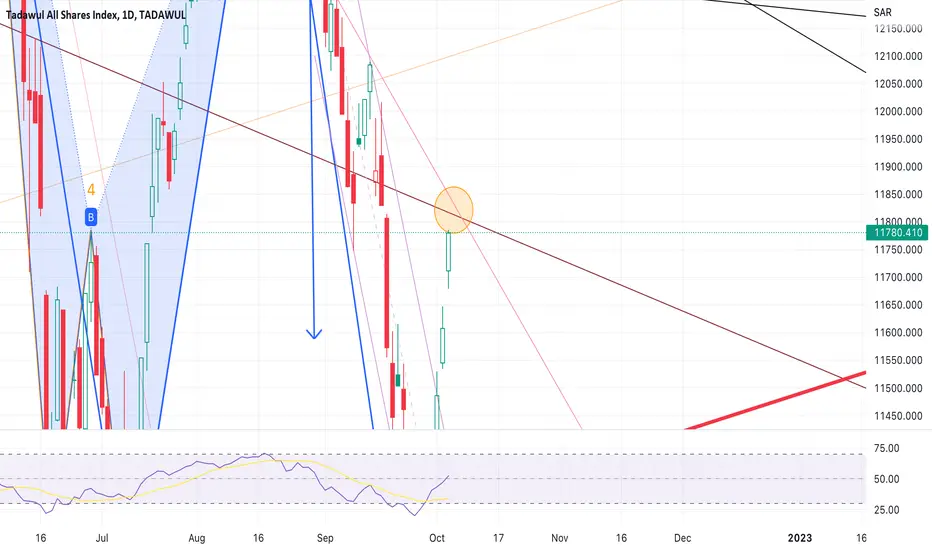
Tasi may fluctuate at the point highlightedSaudi stock holders beware of this zone. The price may show some fluctuations.
CryptoPoints For TASIthis is the trail version Review of CryptoPoints ForTASI , Which is the Forecasting for the trend of TASI


TASI to 9000 levels head and shoulder pattern
Lower high + lower low
the price cannot exceed 50% fibo off 2 waves (one form peak to 11100 levels and other one from the LH to LL
Which lead us to 9000 levels
*scenario fails if we can exceed 12525 with high volume
