Gold sell im looking to sell if we break a candle low without clossing above the vwap target the low
GDF1! trade ideas

Gold trend directionGold 96535 is at crucial trend, M pattern and higher high resistances. We expect Gold will hit the resistance 97364 and drop down to 94078.

Gold- at the CUSP of making history!!Chart Analysis:
Instrument: Gold Futures (1-hour timeframe)
Key Patterns Identified:
Flag & Pole Pattern: A sharp upward move (pole) followed by a consolidation (flag) indicating potential continuation.
Rounding Bottom: A gradual rounding formation indicating accumulation and potential upward movement.
Sloping Trendline Resistance: Marked as a diagonal dashed line indicating an area where price might face resistance.
Key Levels:
97,579: A horizontal resistance level that is crucial for breaking upward.
99,999: A major resistance level, with a note that closing above it could push prices to 106,000.
Gap Zone: Indicated with a query if it will be filled, implying a possible pullback before a further move.
RSI (Relative Strength Index):
Current RSI is around 53, indicating a neutral momentum.
The RSI-based moving average is around 47.43, suggesting that the price might still consolidate before a directional move.
Summary:
The chart suggests a potential bullish continuation if Gold Futures close above the 99,999 mark.
The presence of a rounding bottom supports a bullish bias, but the gap highlighted raises caution about a potential retracement.
Traders might watch for a breakout above the sloping trendline or a gap fill before positioning.

Gold's Correction May Not be Over Yet - Here's WhyHere is my 2-minute technical take on why gold could be looking at a break below 3200 as part of a deeper correction, before it even considers resuming its almighty bullish rally.
Matt Simpson, Market Analyst at City Index and Forex.com

Retrace Complete...but we need 1 more Sweep on Gold!This pullback is what I waited for and it took all week for it to happen. Not sure if I will get the bullish move today being that it is Friday. But if they hit the level I'm looking for I will try at least once. Keeping expectations low since its the end of the week. but things are shaping out for us to have a STRONG bullish week next week.

Bearish Gold SetupGold has been a terrible short for awhile now but from a technical perspective this has to be one of the best setups you can get. Multiple divergences from well know momentum indicators, a variation of the evening star candlestick reversal pattern, and fresh off all time highs. From a pattern perspective it is forming an ascending triangle and it also has Trendline support as well. A break below this triangle would suggest a price target of 2850-3000 depending on what school of thought you align with on triangles.

Gold Should complete the Retrace before giving another DirectionWas expecting the pullback. Now I just need to wait for it to finish before trying to buy it. Price should give us a solid confirmation when its finally ready. want to see them take out some lower levels first. If price gives up a entry during Asia session we could see a nice short.

Gold Future AnalysisFriday & Monday Gold Has Created a Response Supply & Demand, Where the Market Broken Supply With Good Volume Where We Can See a Good Buyers or Bulls Stepped In & expected the market to test 98940 in couple of weeks

Gold BuyMorning star formation after bouncing off higher timeframe support level, would like to see buys
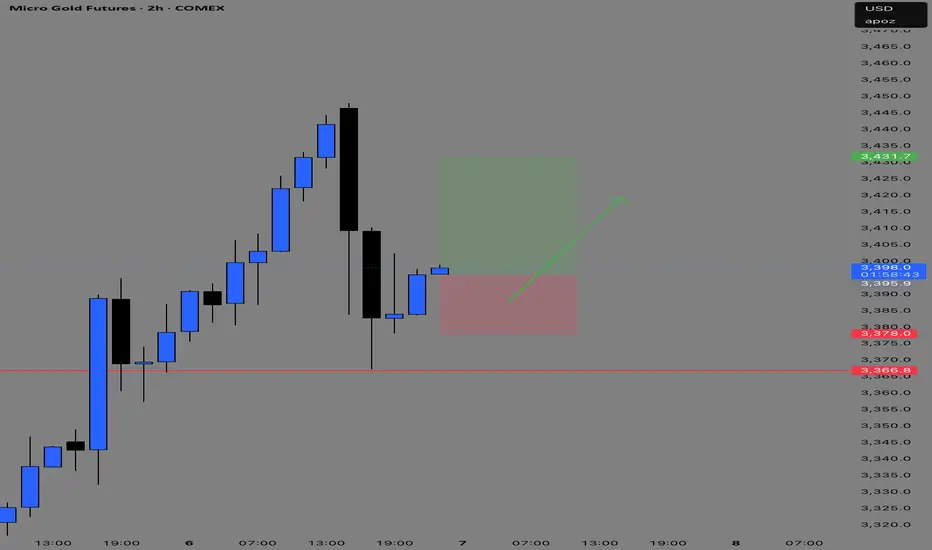
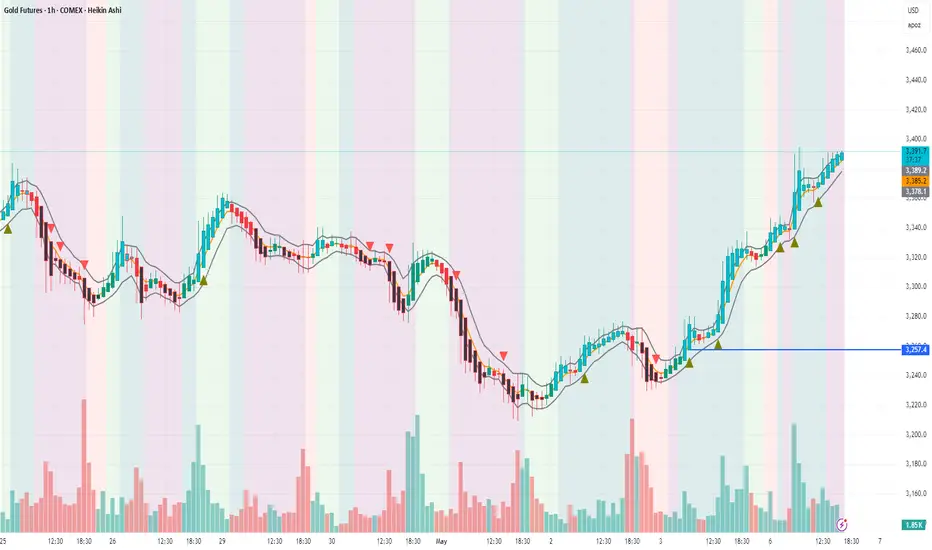
Gold Hourly & 4H Analysis UpdateGold CMP 3290
Yesterday on the Hourly chart , Gold gave a Buy Signal at 3257 , and today it rallied up to 3395 — a clear momentum of 138 points . It also gave a fresh breakout on the 4H time frame , indicating strong upward momentum.
Currently, resistance is seen at the 3420 levels .
If Gold breaches 3420 , we could see further upside toward 3450–3465+ levels .
However, failure to breach 3420 may trigger a reversal .
Positional traders can continue to Hold Gold positions with a Stop Loss at 3355 levels
Price currently Bullish...But will it continue for the week?This is bullish price action i was expecting. Im just now waiting for a solid area for entry. Just have to wait for the killzones and things to line up inside of the killzone. cause outside of the killzones its nothing but chop and impulsive action that can throw you off.

GOLD BUYBuying gold after a large dip with divergence on MACD, in Demand area of range and swept internal lows

GOLD LONGGold is bullish, creating hidden divergence on lower time frames, im waiting for return to OTE levels to buy.


Session Realtime BarJust an idea for better visuals, use 2 of the SessionBar indicator on the chart use the spacing setup with the active bar to the left of the overnight bar in the other indicator...
One indicator for the Active Session Bar: indicating the current session bar.
2nd indicator for the Overnight Session Bar: indicating the overnight session bar.

Bullish Breakout for Gold???Waiting to see what they want to do. Price was bullish all day yesterday and Im trying to see if they want to give a pullback before continuing with the action. I know its best to just wait for the killzone to get the best entry.

GOLD Potential ReversalIt appears that we've reached a significant top in the market, with price action showing signs of a potential dump. Liquidity has been taken out at this level, and we are now looking at lower price targets, which align with the lines below, marking new liquidity points. These areas could serve as key support levels as the market tests them for further reaction.
The price structure suggests a possible drop to the target zones around 3,300 / 3,200 & 2970 where we could see renewed buying interest. Stay cautious as we approach these levels, as they may present opportunities for short entries ahead of the market correction.
Keep an eye on the evolving price action for further confirmations.

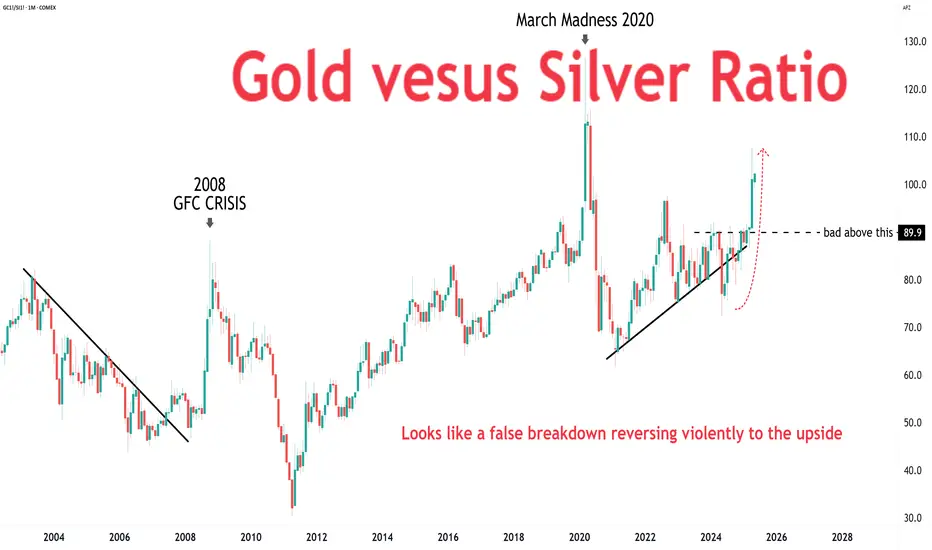
Gold's OUTPERFORMANCE over silver is unrelenting!Gold's OUTPERFORMANCE over silver is unrelenting!
This ratio has a higher chance of unwinding AFTER the stock markets enter a bear market and bottom.
Could take a while.
Multiple markets Monday the gold came to a 382 which means we should be looking for sellers even though there's no real evidence of selling even to this point at 12:30 p.m. on Monday. I have a bias that the smart money is going to drive the gold lower...... but I need more evidence from the sellers. I think there are similar issues with the ES

GOLD LONG IDEA for next week - targeting growth**Direction:** **LONG**
**LONG Targets:**
- **T1 = $3280**
- **T2 = $3320**
**Stop Levels:**
- **S1 = $3220**
- **S2 = $3190**
**Wisdom of Professional Traders:**
This analysis synthesizes insights from thousands of professional traders and market experts, leveraging collective intelligence to identify high-probability trade setups. The wisdom of crowds principle suggests that aggregated market perspectives from experienced professionals often outperform individual forecasts, reducing cognitive biases and highlighting consensus opportunities in Gold.
**Key Insights:**
Gold has continued as a refuge for capital amidst macroeconomic uncertainties, maintaining a strong bullish momentum due to increasing inflationary pressures and global geopolitical tensions. Market experts suggest the Federal Reserve's dovish monetary tone may further fuel demand for Gold, coupled with a weakening US dollar that enhances attractive price levels. The recent trend shows heightened levels of institutional buying, signaling potential for upward movement. Favorable seasonality and demand during market risk cycles enhance its appeal.
Recent supply dynamics, driven by mining constraints and costly extraction levels, contribute to a limited Gold supply market scenario. With central bank reserves gradually accumulating Gold to hedge risks, we anticipate robust demand levels supporting prices. Analysts highlight that hedge funds and sovereign wealth funds show extreme interest towards additional Gold allocation—advising LONG strategies with focus...

MGC Short Setup15 min is developing a hidden divergence. If we get that divergence to confirm, and price reaches OTE level before target is hit im looking to short. Other confluences are supply zones within that area as well as higher timeframe order blocks to add on to resistance.

Gold Setup: Range or Rip? Here's the PlaybookGold’s been on a tear lately — driven by safe haven demand as real yields soften and global uncertainty lingers.
But here’s where things get interesting...
We’re now watching what could be a textbook head and shoulders pattern start to take shape.
📊 Current Range:
Right now, price is stuck between 3380 and 3280 — and it’s acting like it knows it.
⚡ Possible Scenarios:
🔁 Scenario 1: Range Play
Short near 3380
Long near 3280
Let it ping-pong and catch the edges.
📈 Scenario 2: Breakout Long
Confirmation above 3380
Look for momentum follow-through into 3420+
📉 Scenario 3: Breakdown Short
Break below 3280
Eyes on the 3220s for a potential flush
🧠 The key? Drop to the lower time frames near these zones and wait for clean setups during active sessions — especially NY open or post-data volatility.
💬 How are you playing this? Breakout or bounce? Drop your take 👇
#gold #tradingview #futures #technicalanalysis #metals #xauusd #tradingstrategy #macro

Whats the direction for the Week? We should wait to see...Looking for price to go Bullish...But i need to allow Monday to play out first to give us a solid direction. They could go bullish early or they could pull back to give a lower entry first.
