Short GC futures at 3,290.Strategy: Short GC futures at 3,290.
Entry: 3,290 (near current price, aligning with resistance).
Target: 3,250 (support level, 1.2% downside).
Stop: 3,310 (above resistance to limit risk).
Rationale: Bearish technicals (RSI divergence, declining open interest) and USD strength support a short-term pullback, with US Retail Sales as a potential catalyst.
TGF1! trade ideas

STEEL-NERVE SETUP – ARE WE RE-LIVING GOLD’S 2020 BEAR-TRAP?Retail sentiment is ultra-bearish, positioning is cooling, Silver is outperforming and the S&P 500 is screaming risk-on … exactly the cocktail we saw in June 2020, right before Gold & Silver exploded higher.
1️⃣ WHY THIS FEELS LIKE 2020 AGAIN
2025 (now) 2020 (pre-rally) Read-through
> 70 % of TradingView ideas are bearish 💬 > 60 % were bearish Crowd may be offsides again
Managed-money net-longs -18 % from April peak 📉 -25 % from March peak Powder for fresh longs
First monthly ETF outflow (-$1.8 bn) 🚪 Record inflows Capitulation, not euphoria
Gold/Silver ratio down to 94 ⚖️ Fell to 95 Silver leadership = bottoming tell
S&P 500 at new ATH 📈 S&P at new ATH Risk-on backdrop identical
2️⃣ WHAT’S DIFFERENT THIS TIME
Real 10-y TIPS yield +0.7 % (2020: -1 %) → smaller monetary tail-wind.
Gold already at inflation-adjusted ATH → upside could be shorter & sharper, not a fresh super-cycle (yet).
3️⃣ CHECKLIST FOR A REAL BEAR-TRAP
Signal Watch-level
Gold holds $3 200–3 250 (100-d SMA + fib) Daily close above zone
Gold/Silver ratio breaks < 90 Momentum confirmation
CFTC net-longs < 150 k Position flush
ETF flows turn positive Fear → FOMO
S&P stumbles / vols spike Classic risk-bid for Gold
Need 3 of 5 boxes ticked to validate the squeeze thesis.
4️⃣ CATALYST CALENDAR
3 Jul – NFP: sub-75 k print could fire the opening salvo.
9 Jul – Tariff freeze decision: escalation would revive safe-haven demand.
15 Jul – CPI & 30-31 Jul – FOMC: dovish turn + soft data could complete the squeeze.
Disclaimer: This post reflects my personal opinion for educational purposes only; it is not financial advice. Trading futures and commodities involves substantial risk and can lead to total loss of capital—do your own research (DYOR) and consult a qualified professional before acting.

Buying the Dip or Catching a Knife? My Gold Setup Explained.Entered a long position on XAU/USD from the 1H demand zone following sharp intraday selling into a key support level. With gold hovering near $3,300 and a significant testimony from Fed Chair Powell on deck, the setup aligns with both technical rebound potential and fundamental uncertainty that could fuel upside.
The goal here is to play the liquidity vacuum left after aggressive positioning was cleared, with tight invalidation and asymmetric reward.
Technicals:
• Entry aligned with prior price inefficiency and confluence of multiple demand zones
• 1H structure shows clear deviation below the range with immediate buy-side response
• EMA channel flattening, indicating potential compression ahead of expansion
• First target: $3,352
• Risk-managed with defined stop-loss below $3,260
Execution Note: This is not a “hold forever” trade. It’s an opportunistic reaction to unwind + sentiment imbalance.
Fundamentals
• Gold saw a 25% surge in 2024 due to safe-haven demand and dovish policy, but enters 2025 under pressure from:
▫️ A strong USD
▫️ Higher cost of carry
▫️ Speculators taking profit
• Fed policy remains the core variable:
▫️ A hawkish tone from Powell could weigh on price
▫️ Rate cuts would likely revive bullish momentum
• Central bank demand remains supportive
• Geopolitical tensions (Russia-Ukraine, Israel-Iran) could trigger safe-haven bids again.
Bearish headwinds:
• Waning bullish momentum per RSI divergence
• Reduced rate cut expectations post-election
• Powell’s testimony could revive volatility either way.
This is a short-term tactical long, not a macro bet. With sentiment temporarily overextended and key support defended intraday, this is a high R/R window to exploit Powell-related volatility.
Let’s see how price reacts into $3,350+. Any sustained strength there would open room toward $3,400, while failure would confirm a retest of $3,260s.
Note: Please remember to adjust this trade idea according to your individual trading conditions, including position size, broker-specific price variations, and any relevant external factors. Every trader’s situation is unique, so it’s crucial to tailor your approach to your own risk tolerance and market environment.

Long & Short Entry Forecast For GoldCooling war tensions seem to be cooling the Gold bullish rally as well.
But we're still in the same range since April 15th and will likely stay in the range until further notice *or the next tweet*
The Sell entry is great now cos we're near the top of the high volume node, so even if we consolidate around that POC this sell entry will still be putting us closest to the top of the node.
Hold your sell and TP at the VAL . We have a very deep low volume area there and its being a point of support since April. So we can place bets with small risk on hoping it holds cos if it doesn't, it wont be pretty. That is still the best place to buy regardless. So manage your risk accordingly
TP 1 for the Buy trade is at the POC , which also happens to be the top of the huge volume node. Totally make sense to take a decent chunk of profit of your position there, then move you stop loss into profit and grab some pop corn. Depending on the news , the best case scenario of for the uptrend is to continue all the way up to TP2 which is at the VAH
Secure the bag :)
Enjoy

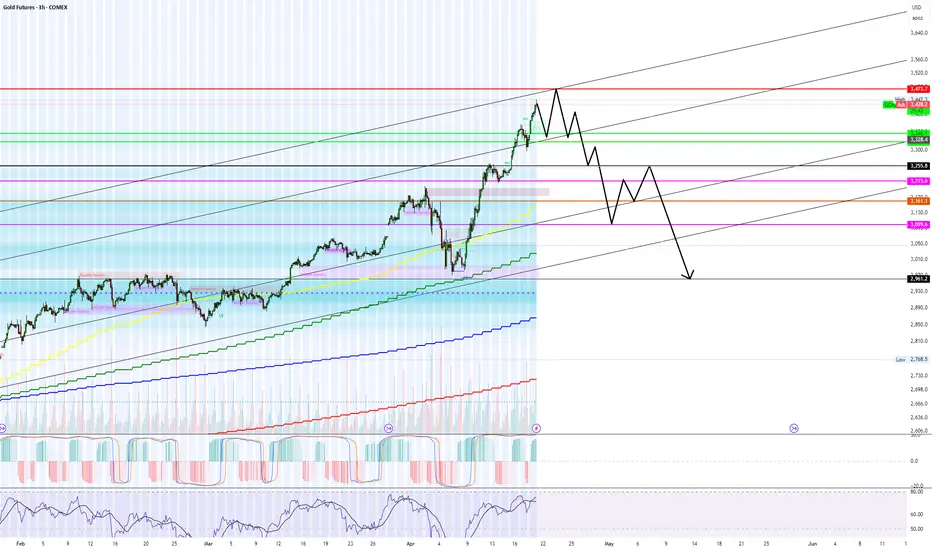
Navigating Gold Futures: Support, Resistance, and ProjectionsCOMEX:GC1!
The chart appears to depict a clear five-wave pattern: I, II, III, IV, and V.
Waves I to III show strong upward movements, indicating bullish sentiment.
Wave IV looks like it could be a corrective phase, with a potential dip before another upward movement in Wave V.
Support and Resistance Levels:
The horizontal lines around 2,800 and 2,575.3 indicate critical Fibonacci retracement levels (38.20% and 50%).
If the price approaches these levels during the correction, they could serve as support, making it a potential buying opportunity.
RSI Indicator:
From the bottom indicator (RSI), we can see fluctuations in momentum, which can aid in timing trades.
Look for interpretations of the RSI: if it trends towards the extremes (overbought/oversold), that could signal reversal points.
Future Projections:
Should the market respect the outlined support levels, Wave V could potentially push towards a new high above 4,000 as indicated by the upward projection.
Market Sentiment:
Overall, the pattern suggests a bullish outlook long-term, but caution is warranted during corrective phases as prices might retrace towards support levels.

Gold, GC!, Sideway to the Downside (Long Term)06/30/2025, 10:30 PM PT
GC! is currently at its max around 3,500.
On the Weekly MACD, the crossover between MACD lind signal line already happened. There is also a bearish divergence on weekly chart.
On the Daily chart, RSI just crosses below 50 on RSI, and MACD shows weakness on the bull (it still not in the bear's territory just yet).
Reversasl to bear side may happen if price stays below 3,200
Bullish will continues if price break out of all time high
Current range for big timeframe from 3,200 - 3,500
Plan for swing trade:
Bullish Case (short term): break trendline. If hold above 3,360, price could go up to 3,400 -> 3,450
Bearish Case (short term): If price rejects and stays below 3,360, price could go down 3,310 -> 3,280
***Disclaimer: This analysis and trade plan are for educational and informational purposes only and should not be considered as financial or investment advice.

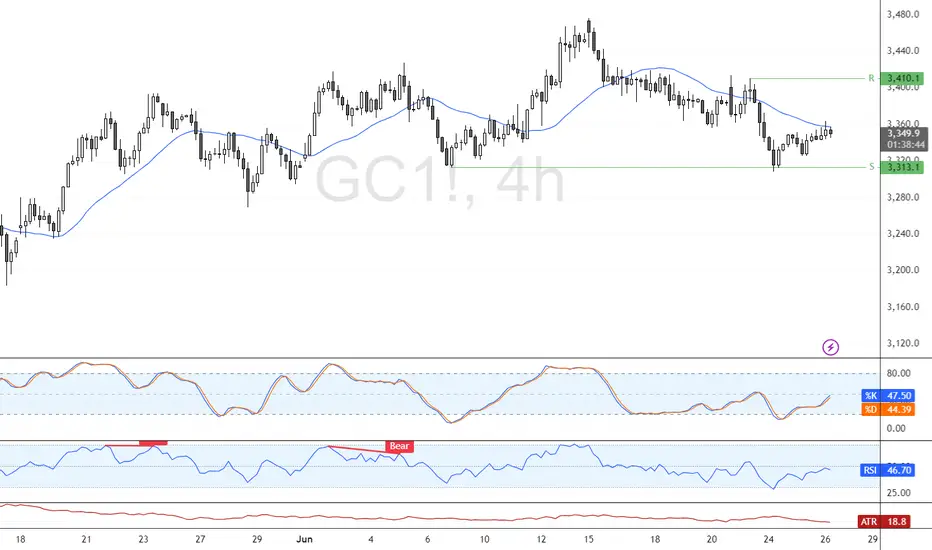
GOLD Can Turn Bearish Now, After Completing a 50% Retracement!GOLD futures analysis for Wed Jun 26th.
Price reached the -FVGand is reacting to it now.
This, after pulling back tothe 50% fib.
Should the FVG fail, Gold is bullish. This is not
supported by fundamentals, though.
As the market environment is more risk on than
off, I expect the -FVG to hold, and the retracement
of the last impulsive move down to end, and a new
bearish leg to begin.
Enjoy!
May profits be upon you.
Leave any questions or comments in the comment section.
I appreciate any feedback from my viewers!
Like and/or subscribe if you want more accurate analysis.
Thank you so much!
Disclaimer:
I do not provide personal investment advice and I am not a qualified licensed investment advisor.
All information found here, including any ideas, opinions, views, predictions, forecasts, commentaries, suggestions, expressed or implied herein, are for informational, entertainment or educational purposes only and should not be construed as personal investment advice. While the information provided is believed to be accurate, it may include errors or inaccuracies.
I will not and cannot be held liable for any actions you take as a result of anything you read here.
Conduct your own due diligence, or consult a licensed financial advisor or broker before making any and all investment decisions. Any investments, trades, speculations, or decisions made on the basis of any information found on this channel, expressed or implied herein, are committed at your own risk, financial or otherwise.

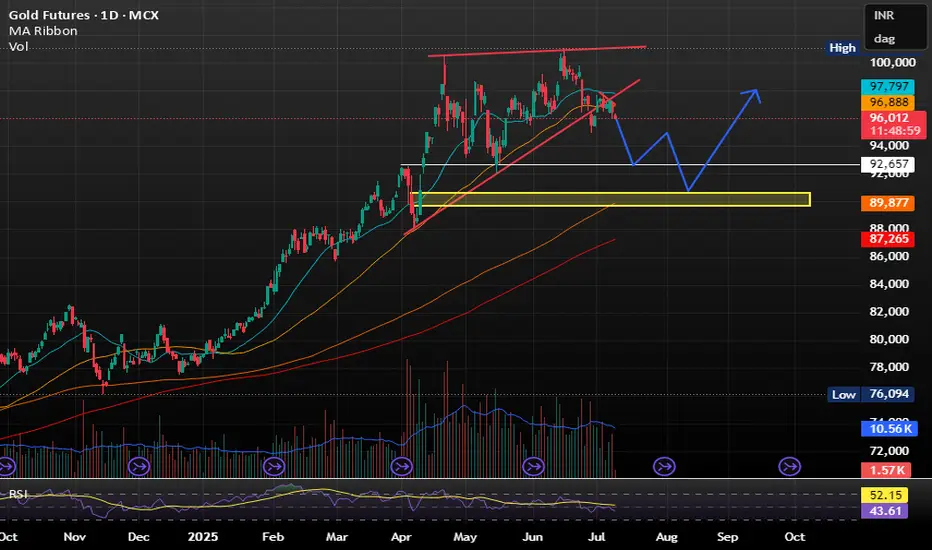
Gold 4H-figment of my imagination. Chart Overview:
Timeframe: 4H (MCX)
Current Price: ₹95,524
Volume: 1.6K
Trend: Short-term bearish
📉 Observations:
1. Break of Support Zones:
Multiple support zones have been drawn on the chart:
Around ₹96,200, ₹94,700, ₹91,800, and finally near ₹86,600–82,200.
Price is now trading below the ₹96,200 support, showing clear weakness.
2. Structure:
This looks like a lower high – lower low formation.
Recent price action has broken previous swing lows, indicating bearish momentum continuation.
3. Next Key Supports:
₹94,700 – could act as the next immediate support (minor bounce possible)
₹91,800 – stronger historical zone
₹86,600 to ₹82,200 – major demand zone (strong support last seen in April)
4. Volume Analysis:
Volume hasn’t spiked significantly on the recent fall, suggesting no panic yet, but also lack of buying interest.
📌 Conclusion:
The trend is weak and corrective, favoring sell on rise until price reclaims ₹96,200 convincingly.
Safe buy zone: Near ₹91,800–₹86,600, if price shows reversal signals.
Watch out: If ₹91,800 breaks, ₹86,600 or even ₹82,200 could be tested.

Global Gold at the Crossroads of CrisisGold’s response to historic geopolitical crises demonstrates that while “big fear” is rapidly priced in, the durability of rallies—or the depth of corrections—depends on a confluence of monetary policy, dollar valuation, oil prices, and the genuine scale of the threat.
At present, the gold market sits squarely between global “fear of instability” and “hope for de-escalation.” Divergent signals from the Fed, global central banks, and oil markets only deepen volatility, making investor decisions more complex. As previous wars (Iran–Iraq, Ukraine) have shown, gold is prone to both scenarios, but its long-term direction will be shaped by a mix of economic, policy, and psychological factors.

Agree to disagree... Gold is topping right now.My price path seen above is a complete guess but it stems from long term trend lines and more importantly order flow from last week.
On Thursday there was a #1 trade on AMEX:PHYS for $200+ Million at the green levels in my chart above (Equivalent levels). PRICE WILL 100% go to my green lines by end of this week 04/25.
We are over shooting the dark pool sale but a lot, however, this is always to trap retail and create fomo/peak fear.
In the correction/recession cycles, gold ALWAYS TOPS LAST before the crash...
Is time to be a Gold Bull?Gold has been steadily repricing lower prices since June 16th after it took out May 16th's High. On Friday, June 27th, Gold moved into the Daily BISI (+FVG) zone and retraced upside. We may see another lower prices to purge the sellside liquidity before reverse upside for the short term. I don't expect another ATH next month, unless we have the right catalyst to do so. I'd anticipate for the price action to remain inside a large consolidation within the current Dealing Range as indicated in the chart. My Bullish case will be if price breaks above the 3500 convincingly, and the Bearish case if it breaks below 3120 convincingly also. In the meantime, we'll have to be satisfied playing tic tac toe inside the range. Don't get married to a strict bias at this time. Stay nimble, and let the price presents itself to you.

Gold Builds Bullish Momentum After $3,294.0 ReboundGold bounced from $3,294.0, forming a double bottom pattern as XAU/USD consolidates near $3,330.0. Stochastic has exited oversold territory, signaling strengthening bullish momentum.
If $3,294.0 holds as support, the uptrend may continue toward the $3,393.0 target.
Compression Structure at Key Inflection PointDescription:
GC is currently trading within a high-probability inflection zone defined by confluence between structural demand, a well-defined fair value gap, and multi-timeframe descending trend line resistance. The asset is compressing between key volume thresholds and macro trend lines, presenting a binary scenario with favourable asymmetry in either direction.
Context & Market Structure
Chart Basis: 4H
Instruments Used:
GC1! (COMEX Gold August 2025 Futures)
20 & 50 EMA for short-term dynamic structure
Manual markups: S/D zones, FVGs, trendlines
Session Data: NY session highs/lows (previous day)
Key Technical Elements
Descending Trendline (Macro):
Initiated from swing high on July 5th, currently acting as dynamic resistance. Confirmed via 3+ touchpoints. Linear regression indicates slope remains intact.
Rising Trend line (Structural Support):
Originates from June 26th low supporting current bullish attempts. Intersection with demand and session low adds weight to this level.
Demand Zone (3280–3286):
Structurally valid with absorption wicks and bullish reaction. Volume clusters indicate localized buyer interest. Rejecting this zone twice already.
Fair Value Gap (FVG) (3297–3304):
Formed post-impulsive leg. Statistically, ~78% of FVGs in gold futures are filled within 2 sessions when no continuation candle follows which is the current setup.
Supply Zone (3314–3318):
Defined from previous consolidation pre-selloff. Aligns with ORB high + unfilled inefficiency, creating layered resistance.
Previous NY Session Levels:
High: 3310.0
Low: 3277.5
Price trading midpoint of this range increased probability of expansion after compression.
Scenario Mapping
Bullish Scenario:
Trigger: Break and 15-min hold above 3305
Validation: Acceptance into FVG zone + reclaim of previous session high
Target: 3316–3320 (supply zone + inefficiency fill)
Extended Target: 3334 swing high (mean reversion area)
Bearish Scenario:
Trigger: Breakdown below 3277.5 session low
Validation: Failure to reclaim demand zone; increased volume on breakdown
Target: 3250 (local HVN & previous accumulation node)
Extended Target: 3227 structural low (trend continuation)
Bias Model:
Volatility Compression: 3-day ATR declining; tightening range.
Mean Reversion Probability (MPR): 58% if price returns to mid-FVG before rejection.
Expansion Probability (EXP): 64% post-session high/low sweep.
Trend Alignment Bias: Bearish until > 3305 is sustained. Below 3280, short bias accelerates.
Summary:
GC1! is currently in compression between confirmed demand and a clean FVG/supply stack, with trend lines boxing in price from both directions. A breakout from this tri-zone structure is statistically likely in the next session. I remain neutral-biased with actionable directional triggers above 3305 or below 3277.
Not a market to guess, wait for confirmation. High-quality setups require patience at the edge of structure.
Staakd Rating: ★★★★☆ (4.6/5)


Gold Eyes Recovery From $3,269 Support ZoneGold dropped 0.65% to trade around $3,290.0, resuming its bearish bias. Immediate support rests at $3,269.1, backed by anchored VWAP. The bullish view holds above this level, aiming for $3,348.9.
A close below $3,259.1 would expose the $3,150.8 support.

GOLD IS MELTING LIKE A ICEGOLD IS MELTING LIKE A ICE -
Trading below 20SMA and 50SMA making it less attractive at current price level.
ALSO RELATIVE STRENGH IS WEAKNING .
As per my view Sell on rise will be profitable for short term .
DOWNSIDE TARGET SHOULD BE WITHIN 92000 TO 90000 .
Gold LongsSolid daily structure for Gold heading into the holiday weekend. Bullish going into next week if price closes bullish on the week.
Daily discount SSL swept and closed back inside the range on Monday. Daily OB confirmed on Tuesday. FVG created and inversion fvg confirmed on Wednesday.
Anticipating Thursday to possibly pull back and offer a prime continuation to the upside. I'd like to see the inversion be respected. Price can wick into the BISI but I don't want to see price close below the BISI. That's a red flag.
Targeting Equal Highs.

$GC / Gold Update - The Bears Strike BackHello fellow gamblers,
I'm making this video to tell you all that nothing has changed!
Both scenarios are still at play and in this video I explain why I'm playing safe.
I might have mentioned in the video some of the trendlines, but at this time, it is best to play off the key levels for any confirmation.
- Levels to watch: 3418, 3363, 3283, 3208

Shorting gold again Well, it does look like there is still some room for a short trade that might actually hit.
Personally, iam not 100% confident in this trade, but i would have liked to see more confirmations before taking the short entry, yet still i think it is still worth the risk.
if you want more confirmations then here is the thing, wait the price to close below this yellow line, and i mean a close not a wick, then wait the price to pullback and take a short position.
my confidence in this setup is 6 out of 10.

GOLD - Lovers Elliott wave - looking strong Short/Medium termGOLD-----Daily counts indicate Excellent bullish wave structure.
Both appear to be optimistic and this stock invalidation number (S L) wave 2 low
target short / long term are already shared as per charts
correction wave leg seems completed (C)
Investing in declines is a smart move for short/ long-term players.
Buy in DIPS recommended
Long-term investors prepare for strong returns over the next two to five years.
one of best counter
Every graphic used to comprehend & LEARN & understand the theory of Elliot waves, Harmonic waves, Gann Theory, and Time theory
Every chart is for educational purposes.
We have no accountability for your profit or loss.

GOLD1! Best Key Level !!This is the 1 hour Chart of Gold!.
Gold is forming a bearish structure and is consistently respecting the resistance zone, leading to a downward move. The key resistance area is between 97,800 and 97,400..
Gold is finding support in the 96,250 – 96,330 zone on the short time frame.
A breakdown below this level may trigger aggressive selling pressure.
Thank you !!

Gold Faces Pressure After Rejection at $3,376 ResistanceFenzoFx—Gold dropped from the $3,376.0 resistance, a level reinforced by the anchored VWAP. June’s bounce at $3,250.0 marks a key support for the broader bullish trend.
If the $3,250.0 support holds, XAU/USD can potentially resume its uptrend. However, a close below $3,236.6 would invalidate the bullish scenario.

IF GOLD drop below 96400 next targets would be 96290 and 96160 If price break 96400 level then u can look to short it for small targets.
