NQ Short (06-24-25)Going with the recent pop as: Short Cover rally or Drop Offset. We may see a decent head fake long set up as some may start to exit (up here). Give it the week with the Friday-Monday Long move to change to Short Rip lower.
UNF1! trade ideas

NQ Range (06-30-25)Same old plays keep repeating: Long in O/N and Dump at Open Drive then sideways to the Close. Today, look short under 881. You can Scalp Shorts or take Longs at any drop/hold. Holiday week so look Long as the volume will be light.

NQ Short (07-01-25)YTD Open level is Blue line below. NAZ up 8% YTD and 40% from YTD low. We may see 8-10% range be the drop zone and retest the YTD Open Level. 22,800 -21,800 has been an extremely low volume 1,000 1 way ride up (not seeing any selling). We should see the sell side show up as NAZ should drop back in the 1,000 soft zone.
4HR YTD Chart below:


4 Powerful, Daily Affirmations for Faith-Based TradersAffirmations make a huge difference.
But why?
It's because they shape our beliefs.
Whatever we think, affects what we say.
Whatever we say, affects what we do.
Whatever we do, is who we become and what our life actual looks like.
Repeat these affirmations daily and watch your life change before your eyes.
Wealth flows to me with ease as I walk in purpose.
I reject scarcity and embrace Kingdom abundance.
I am open to divine provision in expected and unexpected ways.
I have more than enough to thrive and to give.
Happy trading!
For those of you who are trading to make a bigger impact in the world, I am praying for you!

PO3 analysis previewThis chart displays my current working model for PO3 structure, focusing on a multi-timeframe analysis (9m, 27m, 81m, 3H) using volume imbalances and key time-based phases. I’ve marked potential accumulation, manipulation, and distribution zones, alongside session-specific traps (like NYO sweeps) and key reaction areas tied to historical VIs.
The purpose of this post is to visually document these events and align them with real-time behavior. I'm exploring how price respects past VIs and cycles — especially when PO3 bar counts match across timeframes — and whether timing precision (e.g., bar 3/9 revisits) is consistently repeatable.
All annotations are part of a larger test strategy currently in development.

Nasdaq: At the Upper EdgeYesterday, the Nasdaq climbed above resistance at 22,475 points. Currently, the index is positioned outside our turquoise Target Zone (coordinates: 21,751 – 22,425 points), which remains active. Stops for short positions 1% above the zone have not yet been triggered. Our primary scenario remains intact for now: technically, there is room for wave B to reach the next resistance at 23,229 points. Following the B-wave peak, a downtrend is expected with the corrective wave C. With a 42% probability, we anticipate that wave alt.(4) is already complete, and the index may break directly higher within the magenta-colored wave alt.(5), surpassing the 23,229-point mark.
📈 Over 190 precise analyses, clear entry points, and defined Target Zones - that's what we do.

Buy limit order post-1H liquidity sweep I’m 1D Timeframe: The daily chart shows a strong bullish trend with consecutive green candles indicating sustained buying pressure. This suggests institutional accumulation and a lack of significant sell-side resistance.
4H Timeframe: The 4-hour chart presents a continuation of the bullish momentum with recent candles forming higher highs. This indicates ongoing institutional demand and a potential preparation for a further push upwards.
1H Timeframe: On the hourly chart, we observe a slight pullback in the form of a small bearish candle. This could represent a minor profit-taking phase or a setup for a liquidity sweep to capture stops below recent lows before continuing the uptrend.
15M Timeframe: The 15-minute chart shows more pronounced pullbacks, yet these are contained within the overall bullish structure observed on higher timeframes. This could be indicative of retail selling or minor institutional rebalancing.
5M and 1M Timeframes: Both these lower timeframes display increased volatility and a sharper pullback. This is typical in lower timeframes where retail trading is more pronounced, and institutional traders may use these moves to engineer liquidity before making significant market moves.
INSTITUTIONAL THESIS:
Institutions appear to be in an accumulation phase, using minor pullbacks to engineer liquidity and trap retail traders on the wrong side of the market. The expectation is for continued upward movement once these phases complete.
LEARNING POINT:
"1H liquidity sweep before continuation of 4H bullish momentum."
SIGNAL: BUY
SYMBOL: NASDAQ 100 E-mini Futures (NQ1!) ENTRY PRICE: $22,850.00 STOP LOSS: $22,800.00 (below the recent minor low to account for any further liquidity sweeps) TARGET PRICE: $23,000.00 (next psychological round number and potential resistance area) CONDITION: Buy limit order post-1H liquidity sweep confirming a bullish continuation on the 15M timeframe. RATIONALE: The setup aligns with a bullish market structure on higher timeframes, a potential liquidity sweep on the 1H chart, and a continuation of buying pressure indicated by the 4H and 1D charts. STRATEGIES USED: 1H Liquidity Sweep, 4H Bullish Continuation URGENCY: MEDIUM TIMEFRAME: Short-term to medium-term CONFIDENCE SCORE: 85% (based on alignment across multiple timeframes and clear bullish signals) RISK/REWARD RATIO: Calculated as follows:
Risk: $22,850.00 (entry) - $22,800.00 (stop) = $50.00
Reward: $23,000.00 (target) - $22,850.00 (entry) = $150.00
Ratio: $150.00 / $50.00 = 3:1
This trade setup offers a favorable risk/reward ratio exceeding the minimum 2:1 threshold, aligning with institutional trading principles and confirming a high-probability entry for a bullish continuation.

Futures watchlist weekending 7-3-2025Here is my breakdown for the futures market week ending 7-3-2025. Not much has shifted from last week, we continue to note the bullish sentiment and look to scalp the pullbacks and load the dips!!!
I also give you a look into our indicator called Futures Pro! We have an awesome library of tools!

NASDAQ: Minor Pullback, Still on TrackOn Friday, the Nasdaq experienced a slight pullback, which was quickly absorbed at the start of the week. Currently, the index is still developing the turquoise wave B, which should top out just below resistance at 23,780 points, signaling the start of the bearish wave C. This move should lead to the low of the magenta wave (4) within our turquoise Target Zone between 17,074 and 15,867 points. Alternatively, there is a 42% probability that wave alt.(4) is already complete. In this scenario, the magenta wave alt.(5) could carry the index immediately above the mentioned resistance.
📈 Over 190 precise analyses, clear entry points, and defined Target Zones - that's what we do.

Automated Execution: TradingView Alerts → Tradovate using AWS LaI’ve built a fully automated pipeline that takes live TradingView alerts and turns them into real orders in Tradovate. Here’s how it works, step by step (I will provide a video on it):
PineScript Alerts
My indicator/strategy in TradingView fires alert() with a JSON payload (symbol, side, qty, price, ATR, ENV).
Webhook to AWS
Alerts hit an API Gateway endpoint in AWS, invoking a Lambda function.
Lambda Processing
Parse the JSON from TradingView.
Calculate Stop‐Loss & Take‐Profit using ATR.
Authenticate to the Tradovate API (demo & live environments).
Place an OCO order (placeOSO) with proper bracket legs.
Send a confirmation message to my Telegram channel.
Tradovate REST API
Auth: POST /auth/accesstokenrequest → accessToken
List accounts: GET /account/list → find accountId
Place OCO: POST /order/placeOSO with entry, SL, TP
Testing & Monitoring
Local smoke tests of Telegram bot.
Lambda console test events for sample payloads.
CloudWatch logs for debugging & alerts on errors.
Why it matters:
Zero manual steps from signal to fill.
Consistent risk management via ATR‐based SL/TP.
Clear audit trail: logs in AWS + Telegram notifications.
Educational resource for anyone building similar setups
Feel free to ask questions or suggest improvements! Please leave comments.

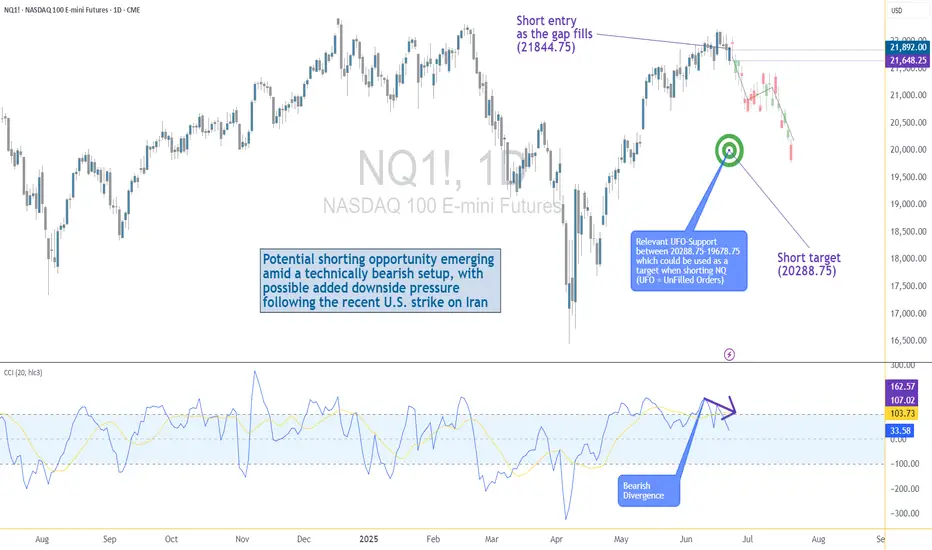
US–Iran Conflict Triggers a Potential Nasdaq Bearish Setup🟣 Geopolitical Flashpoint Meets Technical Confluence
The U.S. weekend airstrike on Iranian nuclear facilities has reignited geopolitical instability across the Middle East. While broader markets often absorb news cycles quickly, high-beta assets like Nasdaq futures (NQ) tend to react more dramatically—especially when uncertainty meets existing technical vulnerability.
Monday’s session opened with a notable gap to the downside, reflecting immediate risk-off sentiment among futures traders. While the initial drop is being retraced intraday, historical patterns suggest that such gap-fills can often serve as ideal shorting zones—particularly when other bearish signals confirm the narrative. The backdrop is clear: this is no ordinary Monday open.
🟣 Bearish Divergence on CCI Builds the Case
From a technical standpoint, the setup gains weight through a clear bearish divergence on the Commodity Channel Index (CCI) using a 20-period setting. While prices recently pushed higher, momentum failed to follow—an early indication that buyers may be running out of steam. This divergence appears just as price approaches the origin of Friday’s gap, a level that frequently acts as a resistance magnet in such contexts. This confluence of weakening momentum and overhead supply aligns perfectly with the geopolitical catalyst, offering traders a compelling argument for a potential reversal in the short term.
🟣 Gap Origin: The Line in the Sand
The origin of the gap sits at 21844.75, a price level now acting as potential resistance. As the market attempts to climb back toward this zone, the likelihood of encountering institutional selling pressure increases. Gap origins often represent unfinished business—zones where prior bullish control was suddenly interrupted. In this case, the added layer of global tension only strengthens the conviction that sellers may look to reassert dominance here. If price action stalls or rejects at this zone, it could become the pivot point for a swift move lower, especially with bearish momentum already flashing caution signals.
🟣 Trade Plan and Reward-to-Risk Breakdown
A potential short trade could be structured using 21844.75 as the entry point—precisely at the gap origin. A conservative stop placement would rest just above the most recent swing high at 22222.00, offering protection against a temporary squeeze. The downside target aligns with a prior UFO support area near 20288.75, where demand previously showed presence. This sets up a risk of 377.25 points versus a potential reward of 1556.00 points, resulting in a reward-to-risk ratio of 4.12:1. For traders seeking asymmetrical opportunity, this ratio stands out as a strong incentive to engage with discipline.
🟣 Futures Specs: Know What You’re Trading
Traders should be aware of contract specifics before engaging. The E-mini Nasdaq-100 Futures (NQ) represent $20 per point, with a minimum tick of 0.25 worth $5.00. Typical margin requirements hover around $31,000, depending on the broker.
For smaller accounts, the Micro Nasdaq-100 Futures (MNQ) offer 1/10th the exposure. Each point is worth $2, with a $0.50 tick value and much lower margins near $3,100.
🟣 Discipline First: Why Risk Management Matters
Volatility driven by geopolitical events can deliver fast gains—but just as easily, fast losses. That’s why stop-loss orders are non-negotiable. Without one, traders expose themselves to unlimited downside, especially in leveraged instruments like futures. Equally critical is the precision of entry and exit levels. Acting too early or too late—even by a few points—can compromise an otherwise solid trade. Always size positions according to your account, and never let emotion override logic. Risk management isn’t a side-note—it’s the foundation that separates professionals from those who simply speculate.
When charting futures, the data provided could be delayed. Traders working with the ticker symbols discussed in this idea may prefer to use CME Group real-time data plan on TradingView: www.tradingview.com - This consideration is particularly important for shorter-term traders, whereas it may be less critical for those focused on longer-term trading strategies.
General Disclaimer:
The trade ideas presented herein are solely for illustrative purposes forming a part of a case study intended to demonstrate key principles in risk management within the context of the specific market scenarios discussed. These ideas are not to be interpreted as investment recommendations or financial advice. They do not endorse or promote any specific trading strategies, financial products, or services. The information provided is based on data believed to be reliable; however, its accuracy or completeness cannot be guaranteed. Trading in financial markets involves risks, including the potential loss of principal. Each individual should conduct their own research and consult with professional financial advisors before making any investment decisions. The author or publisher of this content bears no responsibility for any actions taken based on the information provided or for any resultant financial or other losses.
NASDAQ 100 TECH HEIST: Bullish Loot Before the Bear Trap!🚨 E-MINI NASDAQ 100 HEIST: Tech Rally or Bear Trap? (Thief Trading Blueprint) 🚨
🌟 Hola! Oi! Bonjour! Hallo! Salam! 🌟
Attention all Market Bandits & Tech Raiders! 🏴☠️💻💰
🔥 Thief Trading Intel: We're targeting the E-MINI NASDAQ 100 for a bullish loot grab! Long entry only—high-risk Red Zone ahead: overbought, consolidating, and primed for a reversal. Don’t let the bears ambush your profits!
"Claim your tech treasure and run—you’ve earned this steal!" 💰🚀
🚪 ENTRY: The Tech Vault is Open!
📈 "Swipe bullish loot at any price—the heist is LIVE!"
Buy Limit orders at recent swing lows/highs (15-30 min TF).
📌 Pro Thief Move: SET ALERTS! Don’t miss the breakout.
🛑 STOP LOSS: Escape Plan
📍 Thief SL (Smart Crew): Recent swing low (20,700.00, 4H TF).
📍 Adjust based on your risk, lot size, and orders.
🎯 TARGET: Loot & Exit!
🎯 22,600.00 (or bail early if the market flips!)
⚡ SCALPERS’ QUICK HIT
👀 Long scalps ONLY!
Deep pockets? Raid now.
Light wallet? Join swing traders.
Trailing SL = Your Profit Shield! 🛡️
📢 WHY THIS HEIST? (NASDAQ Bullish Momentum)
Tech rally brewing! Key drivers:
Fundamentals (COT, Macro, Geopolitics)
Sentiment & Intermarket Trends
Index-Specific Analysis & Positioning
🔗 Full intel? Bio linkss checkk! 👉🏻👉🏻👉🏻
⚠️ WARNING: News = Danger Zone! 📡🚨
Tech news moves FAST! Protect your loot:
❌ Avoid new trades during news.
🔒 Trailing SL = Lock profits.
💖 SUPPORT THE TECH HEIST CREW!
💥 SMASH THAT BOOST BUTTON! 💥
More boosts = bigger future heists!
Stronger crew = more $$$ for all!
Profit daily with Thief Trading Style! 📈🏆
Next tech raid coming soon—stay tuned! 🖥️🤑

2025-06-30 - priceactiontds - daily update - nasdaqGood Evening and I hope you are well.
comment: Closing this high at the end of the month is as bullish as it gets. We are close to 23000 that I expect it to get hit. You never know where the top will be, so don’t try to pick it. Market is bullish and bullish only. Even if we print -2% tomorrow, there was no setup and no pattern for you to trade it on. It would be a huge bear surprise and you should never worry about them. Look for the path of least resistance and that is still long. At least for scalps. Bull channel is also still valid until clearly broken, which means a strong print below 22700 would do.
current market cycle: bull trend
key levels: 22600 - 23000
bull case: Bulls want 23000. Market is overbought but that does not matter if we can’t get more selling pressure. Long the pullbacks until it stops working. I can see this going to 23500 but it’s a rough guess and you should not trade based on those.
Invalidation is below 22200.
bear case: Bears got nothing. Don’t look for shorts. Daily close below 22600, then we can start thinking about lower prices again. I still expect this breakout to fail but as of now, we are only going up.
Invalidation is above 23500.
short term: Neutral but I will only scalp long until we see much much bigger selling pressure. 23000 is the obvious target and bears need something below 23700.
medium-long term - Update from 2024-06-29: No change in plans. I expect 20000 to get hit over the next 3 months and maybe 19000 again.
trade of the day: Any long around the high of last week (22823) has been profitable. It was a tight trading range but with a heavy bullish bias going in to today, long scalps were the obvious choice.

NASDAQ 100 ABOUT TO TEST ALL TIME HIGH WITH UPTREND!Hey Traders so looking today at the Nasdaq 100 it's looking really bullish confirmed with 3 bar trendline.
However we are now approaching resistance of this all time high at 22,820 after bounce off support at around 21,500.
So I believe it's a good place to buy on pullback to trendline at around 21,900. This level is 50% of the last big candle with is showing strong bullish momentum.
With Stop under support around 21,400
As it approaches resistance it can do 3 things.
Break through, Pause, or Reverse so will be keeping on eye on how it reacts at that level.
So if bullish watch for pullback if bearish I would not short right now too much buying momentum or at least wait until market breaks suppport or trades below downtrend line.
Always use Risk Management!
(Just in we are wrong in our analysis most experts recommend never to risk more than 2% of your account equity on any given trade.)
Good Luck & Hope This Helps Your Trading 😃
Clifford

NQ Power Range Report with FIB Ext - 6/27/2025 SessionCME_MINI:NQU2025
- PR High: 22713.50
- PR Low: 22669.25
- NZ Spread: 98.75
Key scheduled economic events:
08:30 | Core PCE Price Index (YoY|MoM)
Session Open Stats (As of 12:35 AM 6/27)
- Session Open ATR: 348.99
- Volume: 21K
- Open Int: 260K
- Trend Grade: Neutral
- From BA ATH: -1.7% (Rounded)
Key Levels (Rounded - Think of these as ranges)
- Long: 23239
- Mid: 21525
- Short: 20383
Keep in mind this is not speculation or a prediction. Only a report of the Power Range with Fib extensions for target hunting. Do your DD! You determine your risk tolerance. You are fully capable of making your own decisions.
BA: Back Adjusted
BuZ/BeZ: Bull Zone / Bear Zone
NZ: Neutral Zone
Keep in mind this is not speculation or a prediction. Only a report of the Power Range with Fib extensions for target hunting. Do your DD! You determine your risk tolerance. You are fully capable of making your own decisions.
BA: Back Adjusted
BuZ/BeZ: Bull Zone / Bear Zone
NZ: Neutral Zone

In the 2030's The Nasdaq 100 to 2X the Dow Jones.#CupandHandle don't fight the trend.
Technology vs Industrials.
AI
Robotics
Space Economy
Biotech
Artificial Super Intelligence to power GDP to insane levels.

MNQU2025 SELL IDEAMy bias for MNQ this morning with this trade of 2 contracts running. Would like to see price trade lower to 9:30am lows.
What do you guys think will happen? Will post results of the trade below.
Thanks for watching! Give a like if you enjoyed the explanation and a comment on what you'd like me to share with you guys about my trading journey.

#202525 - priceactiontds - weekly update - nasdaq e-mini futuresGood Day and I hope you are well.
comment: Full bear mode. Below 21600 we see 21000 come real fast and bulls can kiss 22000+ goodbye for months or years. Market has not found enough buyers above 22000 for a month and we not got another potential huge risk-off event which will likely be too much for big institutions to ignore. Print above 22000/22100 means I am wrong.
Last week my bearish thesis was that we go down from last Friday but since market did not touch the daily ema for so long, we got another week sideways. Now bears got help from orange face and I can not see them coming back from this as well.
current market cycle: trading range - daily close below 21500 confirms my thesis
key levels for next week: 20900 - 21800
bull case: Still no close below daily ema but markets failed to print higher highs for 2 weeks now. If we gap down and print below 21500, you can not hold long on hope. Got nothing for the bulls unless they print above 22000 again and even then we can only expect sideways.
Invalidation is below 21500
bear case: I have laid out my bear case for the markets enough by now. I see a move below 21500 as confirmation and especially a daily close below. 21000 is the next obvious target before we can expect a pullback. 20400ish would be my next target below since that is the big bull gap close.
Invalidation is above 22000/22100
short term: Full bear mode. Expecting a big futures gap down on open and a daily close below 21500 if not 21000, which would mean we are in W1 which could be a spike and then only move sideways before W3 comes around. I have drawn a probably path down over the next weeks.
medium-long term - Update from 2024-06-22: Daily close below 21500 is my validation for the new bear trend which has the first bigger target at 21000 but I think we will printed below 20000 again this year. Structure is obviously not yet bearish, so don’t be early if you want confirmation and can’t/won’t scale in to shorts higher. Getting into longer term shorts above 21500 seems like the banger trade right now.

trade idea took 3 trade one got trilled in profit the second one was trilled in stop loss the third one hit the full tp.

NQ2025 – Clean Liquidity Sweep & OB Rejection Leads to Trend ConDescription (for the Idea post):
NASDAQ Futures (NQ2025) - June 19th Setup Breakdown
Market showed textbook Smart Money behavior today.
🔹 Key Highlights:
Price swept the Saturday Low and Wednesday Low, triggering sell-side liquidity.
Reaction from an old Order Block + Fair Value Gap (FVG) zone near 21,780.
Market Structure Break confirmed the bearish bias.
Retest of OB/FVG zone provided a clean low-risk entry.
Targets were cleanly delivered into 21,678 and beyond.
🔹 Confluences:
✅ Liquidity Sweep
✅ OB + FVG Rejection
✅ Volume Spike & BOS
✅ Trend aligned with overall bearish bias
📌 Plan Going Forward:
I’m watching for retracements to prior support-turned-resistance (21,740–21,780) for potential continuation plays. Will stay bearish unless a CHoCH above 21,800 with volume and bullish structure forms.
Comment below with how you traded this setup or how you're managing it!

NQ ShortLook for NQ shorts only after a 4 hour high is taken, as we look for the weekly candle to expand lower. As this week is the 3rd candle in the swing formation
