UNF1! trade ideas

NQ KEY ICT LEVELS - 5th MAY 2025Levels marked on the chart using my free indicator which marks out all of the ICT key levels which can be used for potential POIs where price might react

NQ KEY LEVELS - 5th MAY 2025Key levels marked by using low volume nodes for potential key levels where we may see price react.

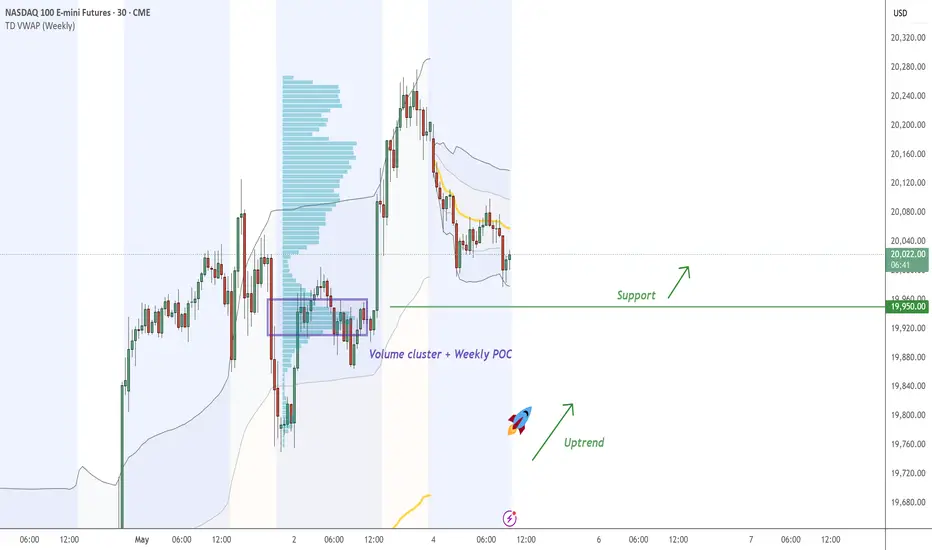
NQ continue with the UptrendOn NQ , it's nice to see a strong buying reaction at the price of 19950 .
There's a significant accumulation of contracts in this area, indicating strong buyer interest. I believe that buyers who entered at this level will defend their long positions. If the price returns to this area, strong buyers will likely push the market up again.
Uptrend and high volume cluster + Weekly POC are the main reasons for my decision to go long on this trade.
Happy trading
Dale
#StangemFormula #StangemSetup #StangemTimeTheory(L+H=HB) = Sweep + Target Above HB we are Buying...Below Hb We are Buying

NQ Power Range Report with FIB Ext - 5/6/2025 SessionCME_MINI:NQM2025
- PR High: 20201.75
- PR Low: 20108.25
- NZ Spread: 209.0
Key scheduled economic events:
09:45 | S&P Global Services
10:00 | ISM Non-Manufacturing PMI
- ISM Non-Manufacturing Prices
Holding previous week's highs
- Advertising ability to break 20400 into Mach 26 daily pivot
Session Open Stats (As of 12:55 AM 5/6)
- Session Open ATR: 634.22
- Volume: 43K
- Open Int: 258K
- Trend Grade: Bear
- From BA ATH: -11.4% (Rounded)
Key Levels (Rounded - Think of these as ranges)
- Long: 20954
- Mid: 19246
- Short: 16963
Keep in mind this is not speculation or a prediction. Only a report of the Power Range with Fib extensions for target hunting. Do your DD! You determine your risk tolerance. You are fully capable of making your own decisions.
BA: Back Adjusted
BuZ/BeZ: Bull Zone / Bear Zone
NZ: Neutral Zone

NQ1 - Did Bitcoin Just Call The Top ?NQ1
Has slumped since week open and printing and Evening Star candle pattern on the 4 hour chart.
So considering that it is in the retracement Golden Window (0.618 - 0.786) and also that Bitcoin is capitulating; this might just be the top here 👍.
Not advice

Nasdaq - April ReviewMore confident in S&P500 reaching my overall objective of the midpoint of the SIBI consequent encroachment than Nasdaq this month but all in all, I am still expecting the market to gravitate higher up to $20,370

Bullish till March 26 High but open for retrace.We are at a daily -BPR at the moment. All daily candles have been bullish so far since April 22. The whole sentiment behind this has been the 90 day tariff pause.
There definitely is a mix of fundamental and technical reasons for both bullish and bearish bias once we achieve this target.
For this week, I would look for a long entry only if NQ retraces lower first. Otherwise would have to just watch it do its thing. Once we hit the March 26 High, I am very open for NQ to go to All time high again because that is what it historically does but I am also completely open for it to start dumping to monthly lows because it seems that the sell-side was not hit and the higher lows made on the 4H chart seem to be very low resistance targets.
Not a good time to marry a bias.

#202518 - priceactiontds - weekly update - nasdaqGood Evening and I hope you are well.
comment: Bulls want at least 20536 now and run all the stops from before the big sell-off. Bears are not doing anything at all, so bulls will likely get it. This could be a breakout-retest and I marked the area for that with the red rectangle. Small chance bears come around next week but for now it’s too early to short and buying into 9 consecutive bull days is statistically beyond moronic.
current market cycle: trading range
key levels: 15500 - 23000 (upper range is a guess, could also become 21000 but for now we don’t know so I assume the higher price)
bull case: 20536 and then 21000. Those are the next targets and bulls are in full control of the market. The measured move from the buy spike at the lows is around 22350 and it’s possible that we get there. I think we need to see a pullback and how deep that will be. If we get only another sell spike and immediate buying for higher highs, we can also assume much higher prices. Above 21100 there is no reason not to go for 23000.
Invalidation is below 19100.
bear case: Bears have nothing. Below 19100 market is neutral but until then, selling this is dumb. Wait for more bears to appear or at least seeing something that resembles a topping pattern. Like a lower high on the 1h chart. Don’t try to be the lucky bear who shorted the exact high.
Invalidation is above 21100.
short term: Neutral. No interest in buying such a buy climax but it’s way too early for shorts. Patience is key.
medium-long term - Update from 2024-04-26: My most bearish target for 2025 was 17500ish. Now I assume we will be in a trading range 16000 - 23000 for much longer.

Bullish monthly candle = reversal candle
weekly candle Closure above PWH
We saw this week AMD, mon-tues (accumulation) Wenesday (manipulation)
thursday (reaccumulation) and distribution on friday.
We are looking for 20631.75 STDV target.
Anticipating monday tuesday to put in a low amd a have one last trending week for a 3candle
dstribution on the weekly.
News to print bullish news. Feds expectation is no change but we could see rate cut to fuel the
bullish move.
4h BKR possible fill for monday to print a OLHC.
1h BKR already have been fill but h4 has a bisi to be filled.

NQ: 183rd trading session - recapDefinitely not my proudest week. My mentality is again at an all time low but again it's always like this on sundays. I for the love of god cannot tell you why it is just like that.
I'll do my personal weekly recap later and I also need to do this:
AFTER EVERY SESSION: JOURNAL THE MOMENT YOU'RE DONE!!!

Navigating Momentum and Structure in Micro E-mini NasdaqIn the fast-paced environment of futures trading, identifying market pressure and momentum shifts is paramount. Through detailed analysis of the MNQM2025 contract on the hourly chart, recent market behavior reveals a compelling pattern of structural rejections, Fibonacci channeling, and trend zone re-tests that provide critical clues for forward movement.
Structural Observations
From late March through early May, price action in MNQM2025 has remained technically disciplined. Several major rejections occurred when price interacted with higher time-frame moving averages—particularly the 4-hour green SMA. These rejections consistently confirmed localized reversals, marking clean transition points from bullish extensions to corrective phases.
On two distinct occasions, downward pressure was decisively rejected at this green SMA level, confirming London session reversals and lending strength to bullish continuation patterns. These signals—though often subtle—were followed by measured impulse waves of 1.6% to 2.5%, with volume confirmation lending credibility to the moves.
Fibonacci Zones and Range Expansion
Applying Fibonacci extension levels from the April rally, we see price respecting the 0.5 and 0.618 retracement levels, retracing from local highs at 20,200 before reasserting upward pressure. Importantly, the 0.786 extension (near 17,360) marked the extreme bottom of a broader accumulation zone, which has since functioned as the base of a full reversal.
Overlaying trend channels, we observe a rising wedge formation supported by a bullish mid-channel line that has acted as a magnet for price action since the breakout. As the market approaches the 20,200–20,321 zone, resistance grows stronger; however, continued volume expansion above 20,205 could signify a breakout into the next Fibonacci zone, targeting 21,050 and eventually 21,900.
Pattern Recognition and Forward Bias
Historical rejections at horizontal levels (19,785, 20,043, and 20,302) formed layered supply zones now functioning as liquidity targets. Price cycling between these levels has provided ample confirmation of a structured market, not a random one. The most recent push shows signs of strength—backed by significant green candles closing above mid-level resistance.
Forward projection from the current chart suggests an extension as high as 22,000 is technically valid, should the structure continue holding and no macroeconomic news induces significant volatility. The 1.618 Fibonacci extension targets and prior highs align with this thesis, presenting a roadmap for traders watching momentum continuation.
Conclusion
This setup reflects a disciplined market respecting technical levels, channel structure, and institutional moving averages. The current movement in MNQM2025 isn’t just noise—it’s a calculated dance between supply, demand, and momentum bias. Traders would do well to monitor these zones closely, not just for short-term gain, but as an insight into broader market intention.

NQ weekly review and Outlook. FOMC week CME_MINI:NQ1!
Expecting buyside expansion on NQ. Lets see how we react in here.

NQ Potential Harmonic Pattern at Resistance ZoneNQ potentially forming harmonic pattern with confluence at resistance area. Wait for confirmation of rejection. Sell area: 21060-20437


WEEKLY ANALYSIS TO HELP YOUR TRADING: Nasdaq, NQ, NAS100A pretty accurate week from my last video analysis if I do say so myself.
This week, I'm anticipating more bullish price action, however, there's also a strong chance for an inside bar which could have price working within last week's trading range. Based on the levels discussed in this video, price has reason to try and close bullish yet again, so I'll be watching price action for entries into longs and managing my risk accordingly.
Happy Trading,
The Meditrader

Is The Nasdaq Bullish? Moving Higher Tomorrow...?In this video, we will analyze the NASDAQ futures for Friday, May 2nd.
Markets are looking tradeable again.
NQ has swept an old high, and retraced today. I like the location of the bullish FVG right below... which price has just tapped into a little while ago.
Look for the reaction from that +FVG, and trade accordingly.
Enjoy!
May profits be upon you.
Leave any questions or comments in the comment section.
I appreciate any feedback from my viewers!
Like and/or subscribe if you want more accurate analysis.
Thank you so much!
Disclaimer:
I do not provide personal investment advice and I am not a qualified licensed investment advisor.
All information found here, including any ideas, opinions, views, predictions, forecasts, commentaries, suggestions, expressed or implied herein, are for informational, entertainment or educational purposes only and should not be construed as personal investment advice. While the information provided is believed to be accurate, it may include errors or inaccuracies.
I will not and cannot be held liable for any actions you take as a result of anything you read here.
Conduct your own due diligence, or consult a licensed financial advisor or broker before making any and all investment decisions. Any investments, trades, speculations, or decisions made on the basis of any information found on this channel, expressed or implied herein, are committed at your own risk, financial or otherwise.

NQ Short (04-30-25)Sell in May on the way? Looks like the Insignificant Range is between the two orange TL's, NAZ will need to break out of range. Red arrow above, 1st Danger Zone cliff (view prior Post's). 4HR has an M developing. Anyway, Tricks/Tweet's can only get you so high. 714 is KL to watch should it lift back up (in the O/N, at 3am).

This is how i get the Sunday opening by aligning Narrative& BiasSo here i zoomed in on the 1hour chart and i see that there was a Distribution Range, i took the high to low Premium and Discount quarters, and then i draw the fibs on the most relevant quarter i am aiming to short from aligning with the PD Array,
noticing how theres some BSL there and theres a 1h SIBI FVG aligning with the Daily Volume Imbalance.

Down Town yo street in a Range RoverCountry Grammar- Nelly
This is also a potential Setup to look into Lower time Farme, this weekly candle is a Bullish Order Block, so we don't want to see the 50% Crossed because were in a sell program, therefore 25% is permissible, and we can then break that quadrant down into quarters and wait for price to sweep the weekly Candles Internal Range Liquidity look for imbalance or inefficiency aligning with the sweep and entering inside of the Turtle Soup

Short Nasdaq Idea for First Stage Distribution Looking at the Daily Chart lining up with the Higher time Frame Bearish narrative underway, i like the idea of shorting Sunday Opening because there's no more opportunity to get out of long positions here once price has exhausted Premium PD Arrays. And I am highly considering Sunday High to Friday Closing Bell Low. There's lots of Low Resistance Liquidity beneath PA currently, there's no money in the laymans wallet, there's no reason for price to go up EXCEPT for Redistribution/continued Short Selling.

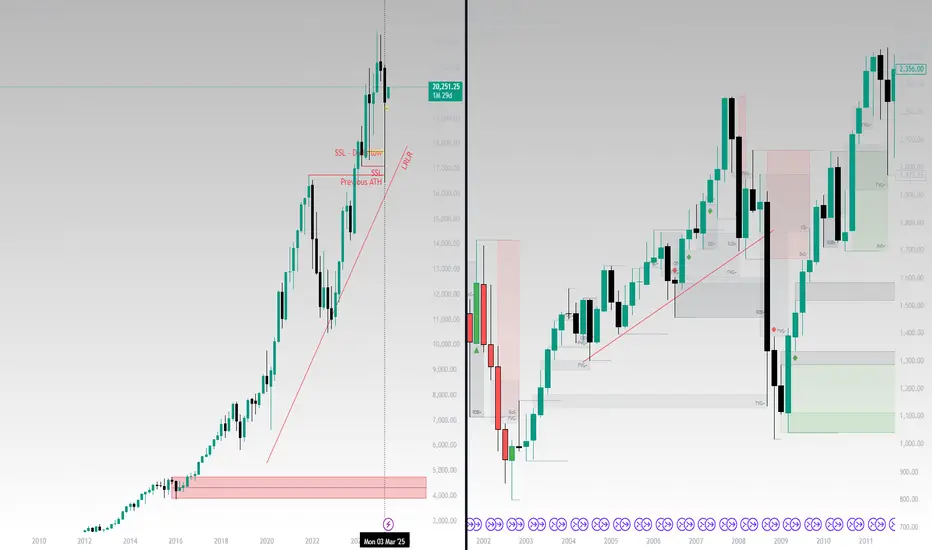
NQ-ES-YM Bearish Long Term Scenario Playing Out VERY BEARISH I think of all the pension funds, all the mortgages, all the war, all the grief and sorrow and depression and inability to find work, there's a whole heap of a mess going on behind the scenes and i hope for the best but expect the worst, and this structure Last Months April Candle is Bearish, and it looks like this Month will be a test of the Distribution Zone and then further down side to the Original Consolidation just like 2008.
It makes a lot of sense to me from the standpoint of not really studying very much but being Intune with the Price Action Analysis, this is a repeating phenomenon in History, the Great Reset, the New Shiny Syndrome, and the classic human behavior to spend more than we have available, over extended and over leveraged individuals will not be readily risk verse,
This Revolving door of money will lead to a bloom of opportunities in a few years, although i see at least 6 months of capitulation to the down side incoming fairly quickly, and i can say this with certainty about one news article i saw recently: US sanctions any country buying Oil from IRAN. Prayers for all, Thank You Jesus, Gods Speed. Amen.