FED Day: NQ Futures planCME_MINI:NQ1!
Today is FOMC day; however, there is a larger geopolitical risk looming, along with the trade war and tariffs situation unfolding.
Recently, we have noted inflation moving lower, although it is not yet at the FED’s 2% target. Retail sales fell sharply last month. Tariffs have not yet resulted in inflation so far, partly due to the 90-day pause, and with possible extensions, some deals agreed upon, and a framework for others in place, tariff uncertainty has considerably reduced.
On the contrary, lower energy prices that supported lower inflation have risen due to ongoing geopolitical issues. Risks remain high for elevated energy prices even if supply and sea routes remain unharmed. In our view, this is due to the fragility of the situation and what it would take to turn the ongoing war into the worst possible outcome.
The FED releases their Summary of Economic Projections. Key data points will be inflation and growth projections, along with interest rate projections and any talks about neutral rates and expected cuts, given the bleak global outlook and growth. The FED is otherwise expected to hold rates steady in this meeting.
Given this, and what Chair Powell says in the FOMC press conference, their commitment towards driving inflation lower versus maximum employment, risks on the growth and employment side have started to worsen. If rate cut bets are moved forward or if markets price in more rate cuts than currently priced in, we may see equity index futures make further gains.
NQ futures are coiling; the yearly VPOC has shifted higher, as we explained in our previous analysis.
Today’s meeting may be key for further fuel higher or lower, depending on how it pans out. Market participants are in a wait and see mode. Markets are accepting higher prices and break of balance is key to determine the direction price may be headed in. Until otherwise proven, markets are range bound and mean reverting from June Composite Volume Profile towards monthly VWAP and VPOC.
UNF1! trade ideas

NQ Range (06-20-25)NAZ U Turn #45 or Bust, we have the Friday-Monday Long Rig test on deck. The F-M trade has been working for about a year and half, the break down here may be a big dipper. Watch the Tweet stall out and Reg Session selling, otherwise to the Moon with F-M lift.

Weekly Market Forecast: Wait To Buy S&P, NAS, & OIL!In this Weekly Market Forecast, we will analyze the S&P 500, NASDAQ, DOW JONES, Gold and Silver futures, for the week of June 22-28th.
The tensions in the Middle East take center stage, as Iran has signaled they are willing to discuss limitations on there Uranium enrichment program. This could allow outflows from safe havens and inflows to risk assets.
Keep and eye on Silver for shorts, in the near term, though.
Let's see if the market tilts its hand early next week. Monday should bring clarity.
Wait for confirmations before entering trades. A break of structure would be ideal! Enter on the pullback to that structure point.
Enjoy!
May profits be upon you.
Leave any questions or comments in the comment section.
I appreciate any feedback from my viewers!
Like and/or subscribe if you want more accurate analysis.
Thank you so much!
Disclaimer:
I do not provide personal investment advice and I am not a qualified licensed investment advisor.
All information found here, including any ideas, opinions, views, predictions, forecasts, commentaries, suggestions, expressed or implied herein, are for informational, entertainment or educational purposes only and should not be construed as personal investment advice. While the information provided is believed to be accurate, it may include errors or inaccuracies.
I will not and cannot be held liable for any actions you take as a result of anything you read here.
Conduct your own due diligence, or consult a licensed financial advisor or broker before making any and all investment decisions. Any investments, trades, speculations, or decisions made on the basis of any information found on this channel, expressed or implied herein, are committed at your own risk, financial or otherwise.

NQ 23/06/2025 BIASHERE IS MY SIMPLE IDEA ABOUT NQ FOR THE NEXT WEEK
everything is clear as the snapshot says

ES/NQ Weekly LevelsES Weekly Levels:
Range: 5,937.01 - 6,109.29
Skew: +.86% 6,062.42
NQ Weekly Levels:
Range: 21,480.38 - 22,247.67
Skew: +1.06% 22,043.39

NQ Update 6.22.25NQ is currently sitting monthly and weekly supply zones.
On the weekly chart, price has consolidated upward but has mostly rejected every push into ATHs.
Note that there are still two untested highs with volumes of 2.336M and 3.392M sitting above. The last time price touched these points there was a 26.60% drawdown on SPY. Indicating lots of liquidity that could still be tapped before making a big move down, IF price decides to drop from here.
In addition to these bearish indicators, price is testing a monthly and weekly downtrend line while creating a head n shoulders pattern. Which could also be signaling a rejection of price.
Despite what I am seeing, I will treat price as if it is still bullish until market structure indicates otherwise.
On the daily timeframe, price can be seen to be clearing trending into a rising wedge. This chart pattern is known to be a bearish pattern but it can also signal a breakout continuation which is why it is important to wait for confirmation and never assume direction.
With price holding and sitting at the uptrend and downtrend on the LTFs, as well as 21,816 being a key area that price seems to be consolidated around. I will wait for price to break consolidation and choose a side before placing any trade on NQ.
If you MUST place a trade, do not place a trade until price moves above or below 21,922 and 21,775, respectively.

NQ Range (06-13-25)Update to prior Post and Short Call at 22,040. NAZ did drop 700 points of the 1,000 expected. Balance of drop to watch for in Reg Session or the typical F-M Long Play is on deck.

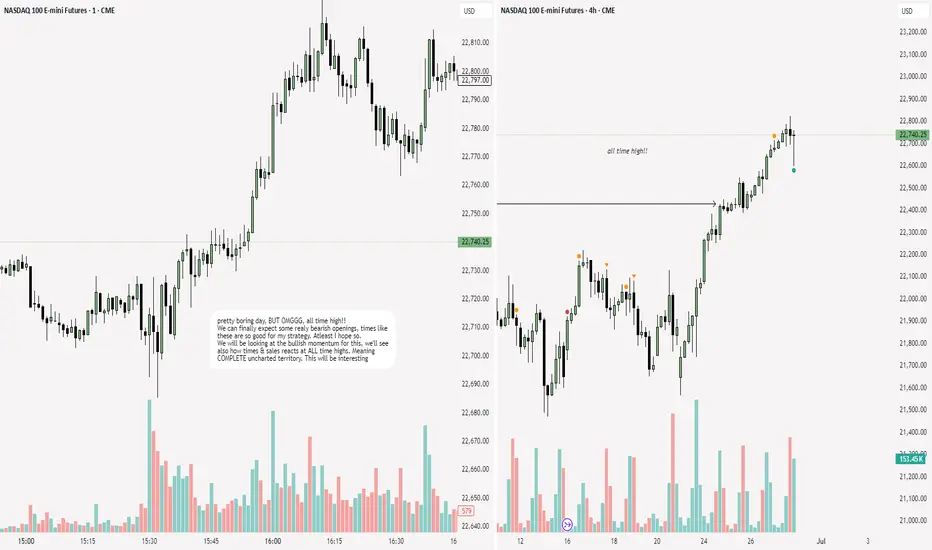
NQ: 205th trading session - recapI'm back after a pretty long vacation. Took the time to just rewind myself n sh#t.
Pretty boring session today, but I was locked in the whole t ime so that's a bonus point

ETHUSD, BTCUSD & Nasdaq Daily Trade SetupsIn this update we review the recent price action in Ethereum, Bitcoin and Nasdaq futures contracts and identify the next high-probability trade setups and price objectives to target. To review today's video analysis, click here!

NQ Power Range Report with FIB Ext - 7/1/2025 SessionCME_MINI:NQU2025
- PR High: 22886.75
- PR Low: 22852.50
- NZ Spread: 76.75
Key scheduled economic events:
09:30 | Fed Chair Powell Speaks
09:45 | S&P Global Manufacturing PMI
10:00 | ISM Manufacturing PMI
- ISM Manufacturing Services
- JOLTs Job Openings
Holding in ATH range
Session Open Stats (As of 12:45 AM 7/1)
- Session Open ATR: 329.32
- Volume: 21K
- Open Int: 269K
- Trend Grade: Neutral
- From BA ATH: -0.1% (Rounded)
Key Levels (Rounded - Think of these as ranges)
- Long: 23239
- Mid: 21525
- Short: 20383
Keep in mind this is not speculation or a prediction. Only a report of the Power Range with Fib extensions for target hunting. Do your DD! You determine your risk tolerance. You are fully capable of making your own decisions.
BA: Back Adjusted
BuZ/BeZ: Bull Zone / Bear Zone
NZ: Neutral Zone

July Seasonality Patterns For Index, Metals and ForexSeasonality can be a useful tool if used wisely (and in context) with current sentiment and news flows. Seasonality really is a backwards looking indicator that can easily be overpowered by key macro drivers. But its strength comes in to play when seasonality aligns with the macro landscape.
With that in mind, I share my seasonality matrix for indices, metals and USD FX pairs to highlight potential patterns for July, then wrap up with an update on my Nasdaq 100 analysis.
Matt Simpson, Market Analyst at City Index and Forex.com.

Nasdaq (NQ) Continues Bullish Cycle, Reaching New All-Time HighThe Nasdaq (NQ) has surged to a new all-time high, reaffirming the strength of its ongoing bullish trend. The index established a significant low on April 7, 2025, at 16,460, following a sell-off triggered by tariff war concerns. This low marked a critical turning point, from which the Nasdaq embarked on a robust upward trajectory, unfolding in a five-wave impulse structure as per Elliott Wave analysis.
From the April 7 low, wave 1 peaked at 18,357.25. A corrective wave 2 then followed which bottomed at 16,735. The index then rallied in wave 3, reaching 22,222, before a shallow wave 4 pullback concluded at 21,565.17, as illustrated on the one-hour chart. Currently, wave 5 is in progress, exhibiting an internal impulse structure in a lesser degree. Within this wave 5, wave (i) topped at 21,944.25, with wave (ii) finding support at 21,738.25. Wave (iii) extended to 22,915, followed by a wave (iv) correction that ended at 22,781. The final wave (v) is expected to conclude soon, completing wave ((i)) of the higher-degree wave 5.
Looking ahead, a wave ((ii)) pullback is anticipated to correct the cycle from the June 23, 2025 low, likely unfolding in a 3, 7, or 11-swing pattern before the index resumes its ascent. In the near term, as long as the pivot low at 21,565.17 holds, any dips should find support in a 3, 7, or 11-swing structure, paving the way for further upside. This technical outlook underscores the Nasdaq’s resilience and potential for continued gains, provided key support levels remain intact.

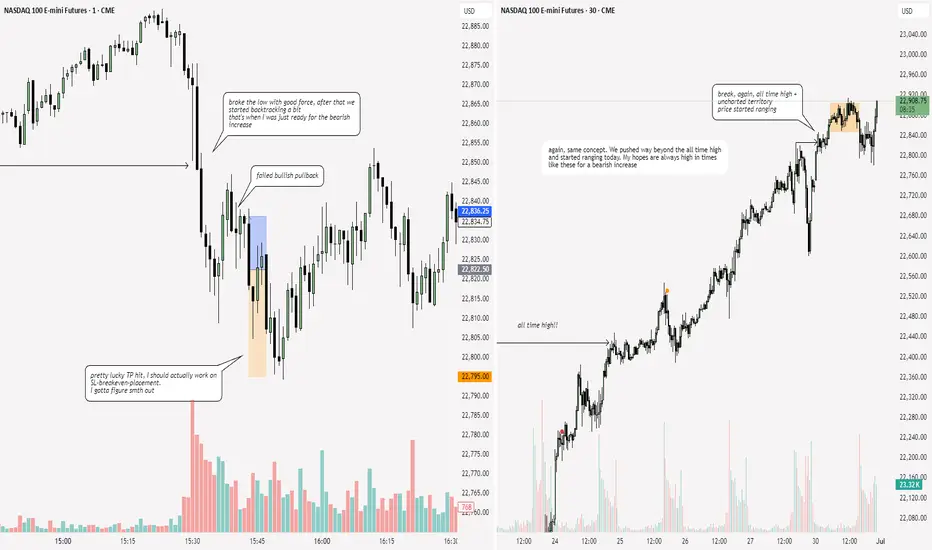
NQ: 213th trading session - recapShort today - winning trade. It was pretty lucky, and thats why I gotta focus on breakeven placement. Maybe when price is around my TP area. I don't want a trade that almost hit my TP to go negative, it's the least I can do
Monday hitter NQ1!Hey took a little break but I’m back with the end of the month Monday Mark up. Playing a little safe and marking in up both a buy a sell. As of now there is a head and shoulder developing and I’m looking for it to be a sell. SL is at $250 and I’ve set 4 TP. Good luck and always remember to follow your trading plan and take proper risk management.

NQ1! H1: Sustaining the Uptrend - Support Areas in FocusOverall Trend: The price of NQ1! is clearly in an ascending channel (or parallel channel), signifying a robust uptrend over the observed period. This suggests sustained buying pressure and higher highs and higher lows.
Ascending Channel (Dynamic Support & Resistance):
The lower trendline of the blue channel has consistently acted as dynamic support. Price has repeatedly bounced off this line upon testing it (highlighted by the light blue oval markers), demonstrating strong buying interest at these levels.
The upper trendline of the channel serves as dynamic resistance, defining the upper boundary of the current bullish movement. Price has approached this line but has not yet shown a clear breakout above it.
Support Levels:
22850 to 22860 (1st Supporting Area): This is identified as the most immediate support zone. The current price (22,862.75) is hovering just above or within this area, indicating it's presently being tested as a potential floor.
22800 to 22820 (Intraday Key Level): Located below the first support, this range represents a significant intraday support level. Should the immediate support fail, this zone would likely be the next area where buyers might step in.
22725 to 22750 (1Hr Support): This is a deeper support level on the 1-hour timeframe, strategically placed near the lower bound of the ascending channel after the June 28th pullback. It suggests a strong historical area of demand or price reversal.
Large Green Shaded Area (Lower Left): This extensive green area at the bottom of the chart represents a broader, long-term support or accumulation zone from which the current uptrend appears to have initiated.
Price Action (Candlesticks):
The prevalence of green candlesticks indicates dominant buying momentum.
The significant red candlestick on June 28th shows a sharp intraday pullback, but the long lower wick suggests that buyers rapidly re-entered the market, pushing the price back up from the lower channel boundary. This rebound reinforces the strength of the dynamic support.
In summary, NQ1! in a clear uptrend, guided by an ascending channel, with distinct horizontal support levels identified that align with historical price action and the channel's dynamic support. The current price is testing an immediate support area.
Disclaimer:
The information provided in this chart is for educational and informational purposes only and should not be considered as investment advice. Trading and investing involve substantial risk and are not suitable for every investor. You should carefully consider your financial situation and consult with a financial advisor before making any investment decisions. The creator of this chart does not guarantee any specific outcome or profit and is not responsible for any losses incurred as a result of using this information. Past performance is not indicative of future results. Use this information at your own risk. This chart has been created for my own improvement in Trading and Investment Analysis. Please do your own analysis before any investments.

Prepare for Record-Breaking Momentum- Current Price: $22534.20
- Key Insights: The NASDAQ has been surging to new highs, fueled by strong
contributions from tech leaders such as Nvidia and Meta. While the index
exhibits bullish sentiment, it's hitting overbought conditions, signaling
potential volatility and positioning opportunities for strategic entries on
pullbacks. Seasonal strength could sustain upward movement in the near term.
Long-term investors may consider accumulation near support levels, while
short-term traders should carefully manage risk as the index approaches
resistance.
- Price Targets:
- Next week target 1 (T1): $22,820
- Next week target 2 (T2): $23,100
- Stop level 1 (S1): $22,433
- Stop level 2 (S2): $22,325
- Recent Performance: Over the past week, the NASDAQ gained 4.15%, outperforming
other major indices like the S&P 500 and Dow Jones. It continues to benefit
from strong momentum in mega-cap technology stocks and semiconductors. The
NASDAQ’s leadership has been supported by impressive gains in Nvidia and AI-
driven sectors, reinforcing its tech-heavy advantage. Smaller-cap indices
lagged behind, showing a divergence that could hint at broader market
hesitation or a rotation in leadership.
- Expert Analysis: Analysts highlight the index's technical patterns, including
overbought RSI levels (above 70) and golden crosses in moving averages,
aligning with historical seasonal trends. While bullish sentiment persists,
overbought conditions may lead to short-term pullbacks. Divergences in major
indices suggest caution, especially with weaker momentum among
semiconductors. Long-term optimism remains, provided demand zones hold firm.
- News Impact: Nvidia continues to drive NASDAQ gains, spurred by its leadership
within the AI and semiconductor sectors. Expansion of 0DTE options for
individual mega-cap stocks could increase trading activity, adding both
opportunities and risks. July’s seasonal tailwinds lend support to the
index’s momentum, but traders should remain vigilant for external events or
corrections.
NQ Power Range Report with FIB Ext - 6/30/2025 SessionCME_MINI:NQU2025
- PR High: 22842.50
- PR Low: 22751.50
- NZ Spread: 202.75
Key scheduled economic events:
09:45 | Chicago PMI
Weekend volatility taking auction into new ATHs
Session Open Stats (As of 12:45 AM 6/30)
- Session Open ATR: 345.85
- Volume: 33K
- Open Int: 261K
- Trend Grade: Neutral
- From BA ATH: +0.1% (Rounded)
Key Levels (Rounded - Think of these as ranges)
- Long: 23239
- Mid: 21525
- Short: 20383
Keep in mind this is not speculation or a prediction. Only a report of the Power Range with Fib extensions for target hunting. Do your DD! You determine your risk tolerance. You are fully capable of making your own decisions.
BA: Back Adjusted
BuZ/BeZ: Bull Zone / Bear Zone
NZ: Neutral Zone

NQ: 212th trading session - recapCANT SAY MUCH ABOUT FRIDAY - FRIDAYS ARE HIT OR MISS.
But I'm excited for next week. How we'll play out etc. I won't be trading tuesdays, and probably not wednesdays. I really can't skip class anymore my teacher will notice and make me fail or smth
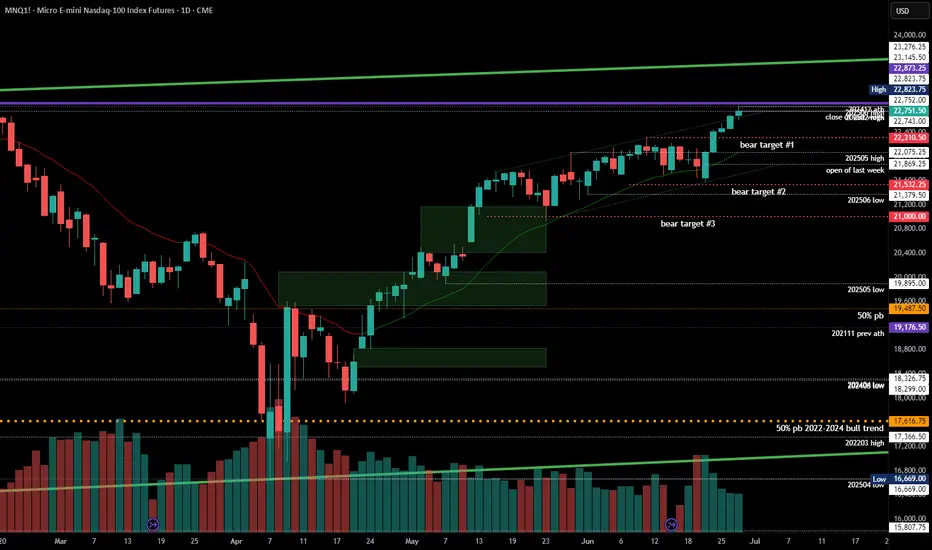
#202526 - priceactiontds - weekly update - nasdaqGood Evening and I hope you are well.
comment: Similar to dax and for most other markets. Cash index made a new ath and broke strongly above the trading range. This is W5 which I thought was cut short but I guess not. It’s most likely the end of the trend since the trading range went on for about 6 weeks, which in this case was likely the final flag. Futures could now aim to print 23000 and touch the bull trend line which began in 2021 and went though the ath from 2024-12.
current market cycle: resumption of the bull trend but likely the final flag and we most likely will top out here around/under 23000
key levels for next week: 22000 - 23000
bull case: Bulls printed 5 consecutive bull bars. They are in full control and could pump it to 23000. Purely based on momentum and squeezing shorts. Got nothing else for the bulls.
Invalidation is below 21500
bear case: Bears gave up on Monday and I doubt they want to fight this until we hit the bull trend line or 23000. Most bears will wait for a clear topping sign that bulls are beginning to take bigger profits before they think about shorts. As of now, bears have zero arguments on their side. Only a daily close below 22300 would confirm this bull trap and fake breakout above the bull channel and then we could test down to 21900ish but for now I think it’s most likely we go higher.
Invalidation is above 23100
short term: Neutral. Will only scalp longs on huge momentum and I will only start thinking about shorts once we break below 22300 again.
medium-long term - Update from 2024-06-29: No change in plans. I expect 20000 to get hit over the next 3 months and maybe 19000 again.
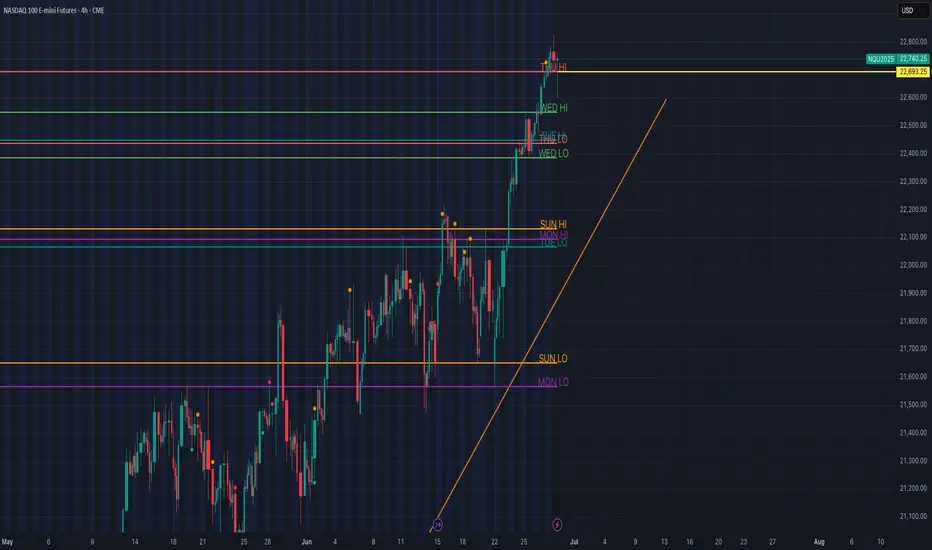
NQ Holding Above Daily Highs – Trend Structure Intact📈 NASDAQ 100 (NQ) – Riding the Trend, Holding Above Key Daily Highs | 4H Chart
NQ remains in a strong uptrend, respecting structure and reclaiming key daily highs going into the final trading days of June.
🔍 Key Observations:
🔼 Price is currently holding above Thursday’s high: 22,740
✅ Strong support formed at Wednesday high: 22,693.25
🔁 Clean reclaim of Tuesday and Wednesday lows — confirming bullish pressure
🔸 Trendline from June 23 low continues to guide the rally
🗓️ Previous Day Levels Providing Structure:
SUN LO / MON LO (~21,550–21,650) → Base of the rally
JUNE 17–21: Price consolidated just below 22,400, forming resistance
JUNE 25: Breakout above Sun/Mon Highs confirmed expansion phase
🧠 Bias & Plan:
Bias: Bullish, as long as price remains above 22,693
🕵️♂️ Watch for reaction around 22,800–22,900 zone (potential exhaustion or continuation)
If we sweep Thursday’s high and shift structure → possible short-term pullback
📌 Summary:
NQ continues to honor the prior week’s highs as new support. The market is trending cleanly with structure, and as long as daily highs hold, the bullish case remains intact.
#NQ100 #NASDAQ #FuturesTrading #SmartMoney #MarketStructure #DailyLevels #PlaymakerTrades
NQ: 211th trading session - recapYo if I'm late posting ever again god will need to punish me with 3 losses in a row istg. Took a loss, don't care it was a good setup
NQ: 210th trading session - recapWow I actually took a trade for once. I'M LATE POSTING THIS AGAIN, had some stuff to do yesterday and I actually just forgot.
Won't happen again hopefully but my session today starts in 30min.
NQ Power Range Report with FIB Ext - 6/26/2025 SessionCME_MINI:NQU2025
- PR High: 22488.25
- PR Low: 22450.25
- NZ Spread: 85.0
Key scheduled economic events:
08:30 | Initial Jobless Claims
GDP
Durable Goods Orders
Session Open Stats (As of 12:25 AM 6/26)
- Session Open ATR: 358.17
- Volume: 20K
- Open Int: 252K
- Trend Grade: Neutral
- From BA ATH: -1.7% (Rounded)
Key Levels (Rounded - Think of these as ranges)
- Long: 22667
- Mid: 21525
- Short: 20383
Keep in mind this is not speculation or a prediction. Only a report of the Power Range with Fib extensions for target hunting. Do your DD! You determine your risk tolerance. You are fully capable of making your own decisions.
BA: Back Adjusted
BuZ/BeZ: Bull Zone / Bear Zone
NZ: Neutral Zone
