UNF1! trade ideas


NQ Power Range Report with FIB Ext - 6/25/2025 SessionCME_MINI:NQU2025
- PR High: 22412.00
- PR Low: 22384.50
- NZ Spread: 61.5
Key scheduled economic events:
10:00 | Fed Chair Powell Testifies
- New Home Sales
10:30 | Crude Oil Inventories
Session Open Stats (As of 12:35 AM 6/25)
- Session Open ATR: 372.52
- Volume: 18K
- Open Int: 253K
- Trend Grade: Neutral
- From BA ATH: -1.9% (Rounded)
Key Levels (Rounded - Think of these as ranges)
- Long: 22667
- Mid: 21525
- Short: 20383
Keep in mind this is not speculation or a prediction. Only a report of the Power Range with Fib extensions for target hunting. Do your DD! You determine your risk tolerance. You are fully capable of making your own decisions.
BA: Back Adjusted
BuZ/BeZ: Bull Zone / Bear Zone
NZ: Neutral Zone

NQ Invalidated Bearish bias!We close above 2H wick CE and went for the Daily FVG. If we close this day, I´m bullish up to All Time Highs.

NQ: 209th trading session - recapToday wasn't the best day: My performance wasn't it tbh. Moreover I'm just really anxious about my future and I did NOT have it controlled during my session, not good.
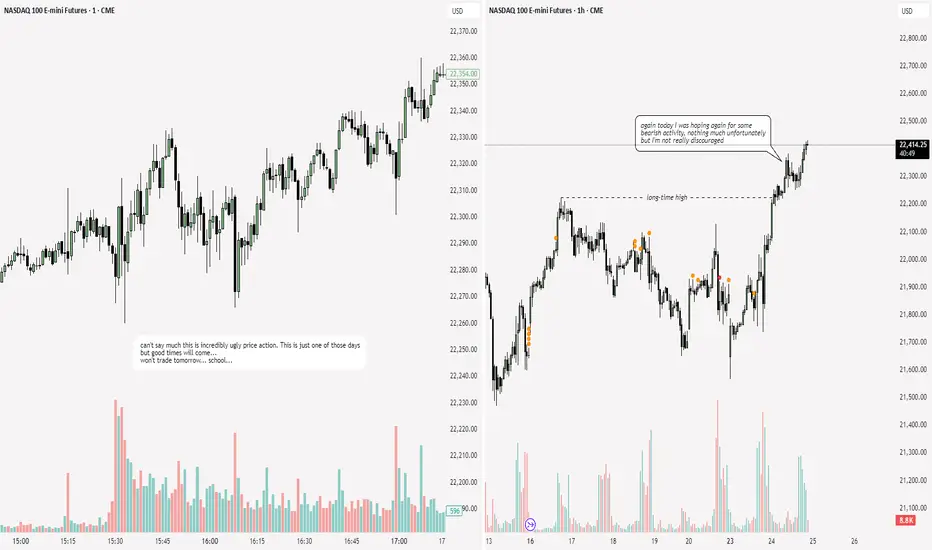
Nasdaq Deep Bearish RetraceI Think we're going to retrace (potentially deeply) on FED release or just before it to then reverse aggressively higher.
I am considering the current "range" on m15 as re-distribution and expecting lower prices on Fed release or just prior before continuation higher that may be delayed till tomorrow next FED.

NQ Power Range Report with FIB Ext - 6/24/2025 SessionCME_MINI:NQU2025
- PR High: 22217.00
- PR Low: 22065.75
- NZ Spread: 337.75
Key scheduled economic events:
10:00 | CB Consumer Confidence
- Fed Chair Powell Testifies
Session Open Stats (As of 12:35 AM 6/24)
- Session Open ATR: 384.68
- Volume: 45K
- Open Int: 240K
- Trend Grade: Neutral
- From BA ATH: -2.8% (Rounded)
Key Levels (Rounded - Think of these as ranges)
- Long: 22096
- Mid: 20383
- Short: 19246
Keep in mind this is not speculation or a prediction. Only a report of the Power Range with Fib extensions for target hunting. Do your DD! You determine your risk tolerance. You are fully capable of making your own decisions.
BA: Back Adjusted
BuZ/BeZ: Bull Zone / Bear Zone
NZ: Neutral Zone

2025-06-23 - priceactiontds - daily update - nasdaq e-miniGood Evening and I hope you are well.
comment: Not even the US President joining a war can start the selling. Truly a special time. Above 22130 there is no reason this can’t test 22300 or higher. Market clearly does not care about the event and the pain trade seems up. Can’t hold bearish thoughts after today’s reversals. Very small chance that if we stay below 22130, bears come around and we test down to 21800 or lower.
current market cycle: trading range
key levels: 21500 - 22300
bull case: Bulls had the following legs up today: 380, 260, 350 points from swing lows to highs. On such a day, this is as bullish as it gets. They now need to print a higher high and then there is no more obvious reason why we can’t test back up to 22300 or higher.
Invalidation is below 21900.
bear case: Bears vanished after the double bottom in the US session and market closed at the high. Which is worst case for bears. Above 21130 they have to cover and I expect an acceleration upwards. If they somehow come around strongly and we go below 21950, then chances are decent that we can test down to 21800 again. Bears need to sell it early tomorrow or the bear trend line is gone and we could go much higher.
Invalidation is above 22130.
short term: Neutral. Only interested in shorts if we stay below 22130. I still think markets are grossly miss-priced and complacent but for now that thesis is wrong.
medium-long term - Update from 2024-06-22: Daily close below 21500 is my validation for the new bear trend which has the first bigger target at 21000 but I think we will printed below 20000 again this year. Structure is obviously not yet bearish, so don’t be early if you want confirmation and can’t/won’t scale in to shorts higher. Getting into longer term shorts above 21500 seems like the banger trade right now.
trade of the day: Buying literally every dip was good.

NQ Power Range Report with FIB Ext - 6/23/2025 SessionCME_MINI:NQU2025
- PR High: 21787.00
- PR Low: 21566.75
- NZ Spread: 491.75
Key scheduled economic events:
09:45 | S&P Global Manufacturing PMI
- S&P Global Services PMI
10:00 | Existing Home Sales
Open weekend gap down ~0.33%
Session Open Stats (As of 12:45 AM 6/23)
- Session Open ATR: 382.81
- Volume: 38K
- Open Int: 234K
- Trend Grade: Neutral
- From BA ATH: -4.8% (Rounded)
Key Levels (Rounded - Think of these as ranges)
- Long: 22096
- Mid: 20383
- Short: 19246
Keep in mind this is not speculation or a prediction. Only a report of the Power Range with Fib extensions for target hunting. Do your DD! You determine your risk tolerance. You are fully capable of making your own decisions.
BA: Back Adjusted
BuZ/BeZ: Bull Zone / Bear Zone
NZ: Neutral Zone

NQ: 207th trading session - recapPretty good end to a week. I'm completely focused on scalping for the next week.
I will be having my session everyday exepct wednesday: Schools just too long and I gotta stop skipping class or else my p.e teacher will actually catch on to it

NQ- HTFOn 4 H, we have an inverse and BPR reaction from 4 H order block.
And we have LRRLon 4 H, My target on HTH will be 21996
NQ Power Range Report with FIB Ext - 6/20/2025 SessionCME_MINI:NQU2025
- PR High: 21930.25
- PR Low: 21745.75
- NZ Spread: 412.0
Key scheduled economic events:
08:30 | Philadelphia Fed Manufacturing Index
Session Open Stats (As of 1:05 AM 6/20)
- Session Open ATR: 377.21
- Volume: 155K
- Open Int: 230K
- Trend Grade: Neutral
- From BA ATH: -4.2% (Rounded)
Key Levels (Rounded - Think of these as ranges)
- Long: 22096
- Mid: 20383
- Short: 19246
Keep in mind this is not speculation or a prediction. Only a report of the Power Range with Fib extensions for target hunting. Do your DD! You determine your risk tolerance. You are fully capable of making your own decisions.
BA: Back Adjusted
BuZ/BeZ: Bull Zone / Bear Zone
NZ: Neutral Zone

NQ POSSIBLE DIRECTION.Waiting for your kindfull thoughts or ideas regarding to my analysis.
NASDAQ...

High volume nodesprice bouncing between until we will see a push out of value to a new level, high or low, we will see

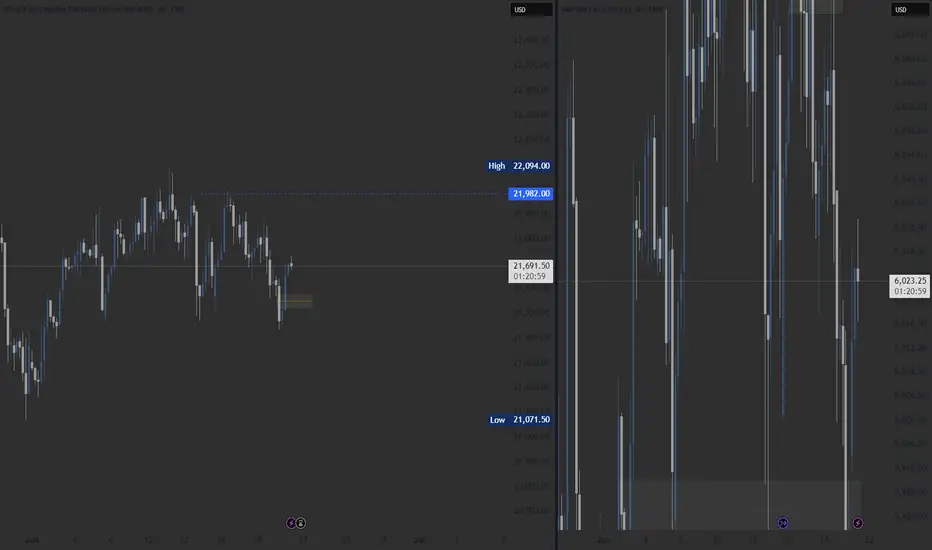
Trade Idea: Nasdaq Q2 Premium Rejection | Mother of HTFNQ is showing early signs of macro exhaustion after rallying deep into Q2 premium territory and failing to hold above it. A key swing high was formed on June 13, in perfect confluence with:
🔻 Q2 0.75 level
🟥 Quarterly Premium Zone
📉 Bond market divergence (ZB1! failed to confirm ZF1!/ZN1! strength)
🗣️ (Not a bond expert, just observing behavior)
This type of confluence has historically preceded liquidity draws back to EQ or even discount levels.
📐 Levels I’m Watching
Q1 Mid (~20,975): Strong magnet if we break lower
Q2 EQ (~19,975): Next likely draw if structure shifts
MOOD (~21,460): Holding above this pauses deeper sell bias
Q2 Premium Zone (22,300–22,500): Rejection zone and CPI swing high (June 11-13)
Discount Block (18,300–17,500): Long-term liquidity void if momentum builds
❌ Invalidation
NQ reclaims and holds above 22,300–22,500
⚠️ Disclaimer
This is NOT financial advice. All content shared is speculative and intended for educational or entertainment purposes only. Futures trading carries significant risk and may not be suitable for all investors. Always do your own research and consult with a licensed financial professional before making trading decisions.


NQ: 206th trading session - recapOk session, hopes were high at the beginning but it was a bit short lived.
Don't got much to say tho, til tomorrow

NAS/NQ 4H Buy IdeaLooking for price to break and retest the current high to continue higher
OR
Looking for price to go back and fill the imbalance left below current price to then continue higher

NQ1 wait in the zone for long*The content on this analysis is subject to change at any time without notice, and is provided for the sole purpose of assisting traders to make independent investment decisions.

NQ Power Range Report with FIB Ext - 6/18/2025 SessionCME_MINI:NQU2025
- PR High: 21940.50
- PR Low: 21863.00
- NZ Spread: 173.50
Key scheduled economic events:
08:30 | Initial Jobless Claims
10:30 | Crude Oil Inventories
14:00 | FOMC Economic Projections
- FOMC Statement
- Fed Interest Rate Decision
14:30 | FOMC Press Conference
AMP margins increase to 25% for expected FOMC volatility spike
Session Open Stats (As of 12:45 AM 6/18)
- Session Open ATR: 375.35
- Volume: 31K
- Open Int: 213K
- Trend Grade: Neutral
- From BA ATH: -3.8% (Rounded)
Key Levels (Rounded - Think of these as ranges)
- Long: 22096
- Mid: 20383
- Short: 19246
Keep in mind this is not speculation or a prediction. Only a report of the Power Range with Fib extensions for target hunting. Do your DD! You determine your risk tolerance. You are fully capable of making your own decisions.
BA: Back Adjusted
BuZ/BeZ: Bull Zone / Bear Zone
NZ: Neutral Zone

NQ Bulls Teasing a Breakout – But Watch That 4H RSI Divergence We’re at a decision point here on NQ.
📌 Bullish case: We’ve got a clean inverse H&S on the 5-min sitting right on the weekly pivot. If we reclaim the daily pivot and the 30-min VWAP (red line), we could get a squeeze toward 21,960, where prior supply sits.
📉 Bearish case: A break below 21,650 cracks the head and confirms downside toward 21,480.
⚠️ Don’t ignore that 4H RSI divergence. Momentum is fading. If buyers want this, they’ve got to show up now.
📊 Timeframes used:
4H: macro momentum divergence
30M: chop zone with directional potential
5M: inverse H&S near key support
1M: low timeframe momentum shift
🔭 Scenarios plotted for both directions. Choose your trigger.
#nasdaq #futures #MNQ #tradingstrategy #priceaction #headandshoulders #vwap

2025-06-17 - priceactiontds - daily update - nasdaq
Good Evening and I hope you are well.
comment: Big up, big down, big confusion. Market rallies 500 points yesterday and today we get a late bear breakout and close below 22000. Traps on both sides and I am not believing in bear strength what so ever. I see this as a triangle and 22000 is the middle. Chop chop.
current market cycle: trading range
key levels: 21700 - 22300
bull case: Bulls want to stay above 21900 and print a higher low to then re-test 22300. Today they were weak and let the bears close below 22000 which was unexpected, giving yesterday’s bullishness. Tomorrow we have FOMC and I doubt market can move far from 22000 tomorrow. Any longs closer to 21800 make sense.
Invalidation is below 21680.
bear case: Bears left behind a gap up to 22015 but I doubt it can stay open. We have to decent trend lines below us and bears would need to break strongly below 21900 to try and go for 800 or even 700. Bears do not have any arguments to go below 21700 so I won’t make up any. That doesn’t mean it can not happen but it’s unlikely.
Invalidation is above 22230.
short term: Completely neutral around 22000. Only interested in longs below 21900 and shorts closer to 22100.
medium-long term - Update from 2024-06-15: Daily close below 21450 is my validation for the new bear trend which has the first bigger target at 21000 but I think we will printed below 20000 again this year. Structure is obviously not yet bearish, so don’t be early if you want confirmation and can’t/won’t scale in to shorts higher.
trade of the day: Buy low, sell high and scalp. Clear range 22000 - 22100 and the late bear breakout was ok if you made your money before. I do think it was unusual that we did not close the gap to y close 22176.

