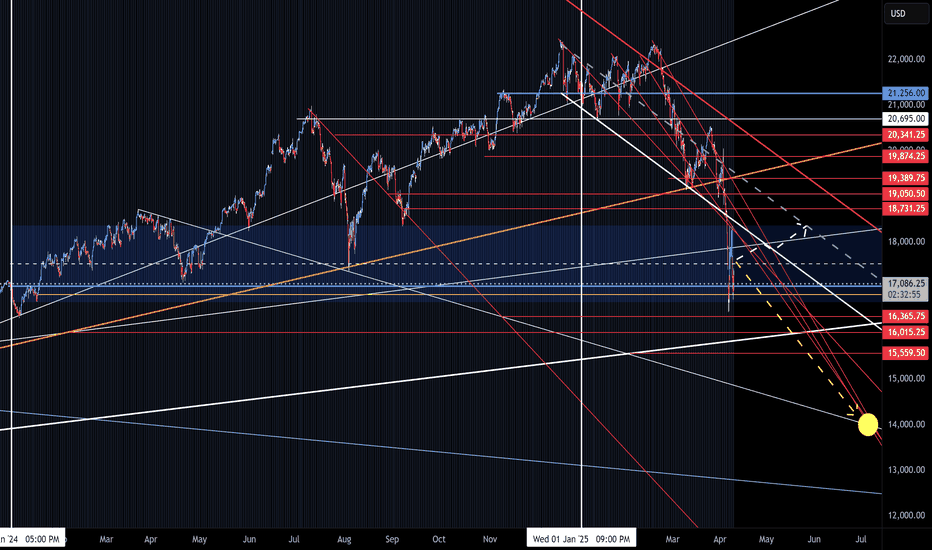
NQ Range (04-09-25)NAZ Range, again. The range to watch is 16,700 - 18,300. This chart may be viewed as 2024 being a Long Trap set up, KL 17,500 is Long above and Short below for now. Look for the NAZ to retest the KL and rotate around inside the range. Lower yellow circle, lower range break out over the Danger Zone Edge (16,500-300). Looking move sideways than lower PA today and for next few days, should push/pull PA show up, look SHORT.
UNF1! trade ideas
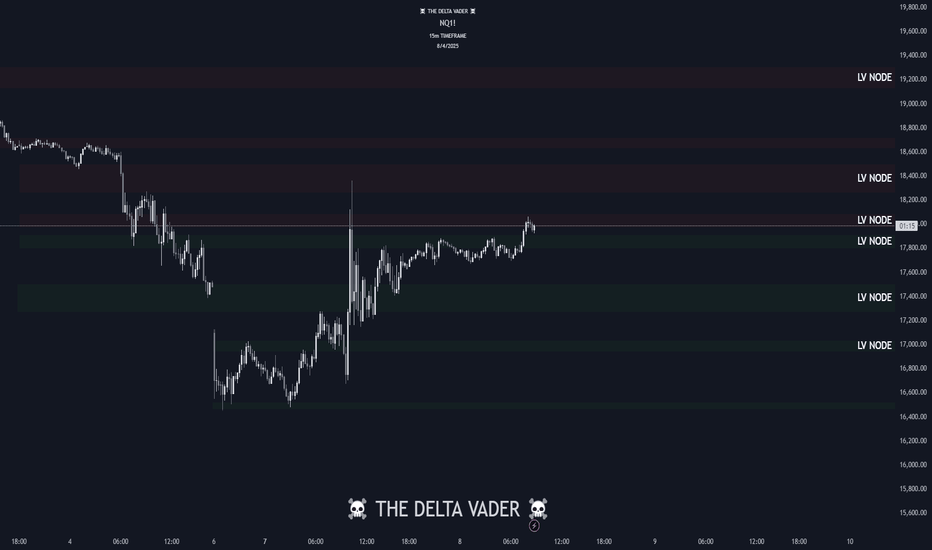
MNQ!/NQ1! Day Trade Plan for 04/08/2025MNQ!/NQ1! Day Trade Plan for 04/08/2025
📈18365
📉17755
Thanks to all my followers! Truly appreciate the support!
Please like and share for more NQ levels Tues & Thurs 🤓📈📉🎯💰
*These levels are derived from comprehensive backtesting and research and a quantitative system demonstrating high accuracy. This statistical foundation suggests that price movements are likely to exceed initial estimates.*
Today analysis for Nasdaq, Oil, and GoldNasdaq
The Nasdaq closed lower after forming an upper wick at the 5-day moving average on the daily chart. If it had closed with a bullish candle, a technical rebound from the oversold condition could have opened the way to the 10-day moving average, but instead, it ended with a bearish candle.
The daily chart still shows a sell signal, but the best-case scenario would be for the market to form a double bottom pattern after confirming a short-term low and attempt another rise toward the 10-day moving average.
On the intraday charts, there's a high probability that the market will show a double bottom during the pre-market session, especially since there's no clear sell reversal on lower timeframes yet. The 240-minute chart shows a golden cross on the MACD, and although a death cross hasn't yet occurred, the large gap between the MACD and the zero line suggests a continued corrective trend.
As long as the death cross doesn't materialize, buying on dips near the bottom remains favorable. The 16,500 level is a strong support zone on the monthly, weekly, and daily charts, so shorting is not recommended — better to lean toward long setups. With the FOMC minutes due out early tomorrow and the CPI report on the horizon, volatility is expected to rise as the market attempts to form a bottom. Stick to buying on dips, manage risk carefully, and reduce leverage in this volatile environment.
Crude Oil
Crude oil closed lower, continuing its recent downtrend on the daily chart. Concerns over a global economic slowdown and increased production from OPEC nations are dampening the upside. Although the sell signal on the daily MACD remains, there's still potential for a short-term rebound toward the 5-day moving average. If trading short, make sure to set a stop-loss, especially near the strong $57 support zone, where shorting is riskier.
On the 240-minute chart, the MACD has re-crossed into a death cross, showing signs of a third wave of selling pressure. However, there's still a chance of bullish divergence, so avoid chasing short positions. The $57–$59 support range remains strong, and unless this level breaks, buying on dips offers a more favorable risk-reward ratio. Note that today's U.S. crude inventory report could introduce more volatility, so trade carefully.
Gold
Gold closed lower with an upper wick on the daily chart. While the price is still above the 0 line on the MACD, if it pulls back to the previous high resistance area, which coincides with the lower Bollinger Band and the 60-day moving average, it may present a good buying opportunity for swing trades. On the weekly chart, gold is still moving within a sideways range, trapped between key moving averages. With the FOMC minutes today and the CPI tomorrow, it's important to monitor whether the price breaks out of this range.
The 240-minute chart shows that the MACD has not yet formed a golden cross, and there's still a large gap from the 0 line. If MACD rebounds and then corrects again, it's crucial to check whether a double bottom around the 2,980 area is forming. Overall, gold remains a buy-the-dip candidate, and if the price falls to around the 60-day moving average, it could present a great swing entry.
Investor sentiment is reaching extreme levels, and we're witnessing unusually fast and wide price swings. It's hard to rely on daily or weekly charts alone, so it's important to focus on short-term price action and use appropriate leverage for your strategy.
The market will always be open. Survival and consistent profitability are what matter most in the long run. Stay disciplined, manage risk carefully, and take a long-term view as a trader.
Wishing you another day of successful trading!
If you like my analysis, please follow me and give it a boost!
For additional strategies for today, check out my profile. Thank you!
NQ Power Range Report with FIB Ext - 4/9/2025 SessionCME_MINI:NQM2025
- PR High: 17240.00
- PR Low: 16971.00
- NZ Spread: 601.5 ⚠
Key scheduled economic events:
10:30 | Crude Inventories
13:00 | 10-Year Note Auction
14:00 | FOMC Meeting Minutes
Mechanical pivot off Monday's high
- Rotating back into 16700s inventory
- AMP margins and volatile session open indicates we're still in the volatility storm
Session Open Stats (As of 12:45 AM 4/9)
- Session Open ATR: 692.29
- Volume: 84K
- Open Int: 256K
- Trend Grade: Bear
- From BA ATH: -24.4% (Rounded)
Key Levels (Rounded - Think of these as ranges)
- Long: 20954
- Mid: 19246
- Short: 16963
Keep in mind this is not speculation or a prediction. Only a report of the Power Range with Fib extensions for target hunting. Do your DD! You determine your risk tolerance. You are fully capable of making your own decisions.
BA: Back Adjusted
BuZ/BeZ: Bull Zone / Bear Zone
NZ: Neutral Zone
2025-04-08 - priceactiontds - daily update - nasdaqGood Evening and I hope you are well.
comment: W3 was climactic and there could be a possible W5. Right now we are in W4 and the given range will likely be respected and not broken. I will most likely mean reverse to 20000 over the next days.
current market cycle: strong bear - W3 concluded - W5 possibly down to 16000 if we get one but W3 could have been the end of it since it was so climactic and extreme.
key levels: 16000 - 18400 (but I doubt we get below 16400 for the next days/weeks)
bull case: Both sides make good money currently and we have a big range to trade. 17500 is my neutral price where I expect market to spend most of it’s time for the next days/weeks. We should see at least 10 session sideways to up movement.
Invalidation is below 16400.
bear case: Bears can not expect this to continue down for now and they have to continue to keep the market below 19000 and leave a big gap open up to 19350. Earnings start on Friday and I have no idea how that will go. So no bearish bias since my targets are all met.
short term: Neutral around 17500 and only interested in fading the extremes in given range.
medium-long term - Update from 2024-03-16: My most bearish target for 2025 was 17500ish, given in my year-end special. W3 overshot it by 1000 points. Now my bearish bias is gone and I will wait how this unfolds. Big uncertainty for this year but I think this selling is overdone and big bois are buying with both hands below 17000.
trade of the day: Selling the double top above 18300 for a casual 14000 point drop. Congratulations if you took it and held through it. I did not.
NQ Range (04-08-25)Staying with the Range forecast. NAZ is inside the Yellow arrow range (yesterday post). The Box is the range to watch, NAZ may go above and drop back inside to retest KL's 17,027-16,845. You can see new declining channel above. Below is 30M chart.
Watch all moves in both directions with VIX this high. Yesterday (chart below) we had a tweet, leak, comment, etc. regarding tariffs (unofficial, not credible source) that move the NAZ 1,700 points in 30 minutes. Expect some games during lower volume periods (to the upside).
Let's go Meathead.
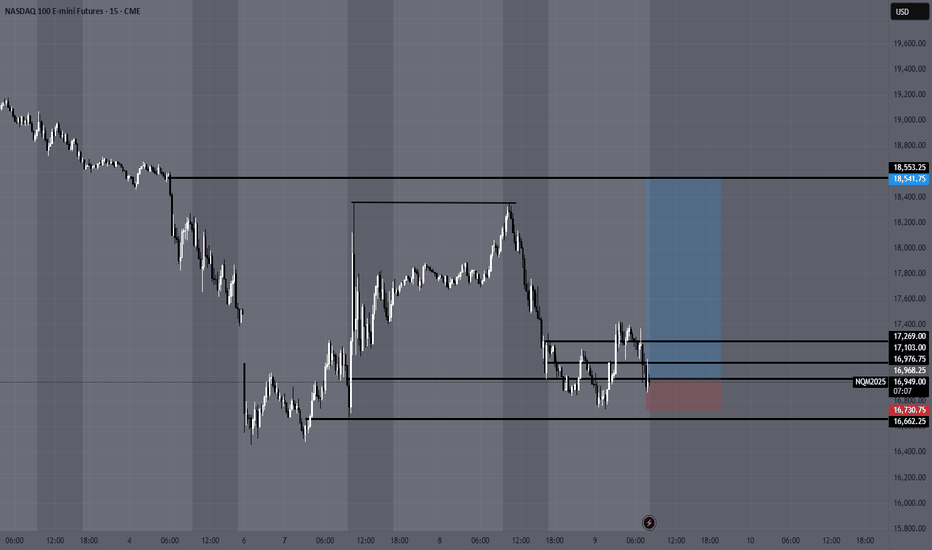
NQ - Supply/Demand Trade Idea for Longs
NQ is on its retracement from previous week deep dive. I am currently looking for price to retrace and test previous resistance as support. Once it gives this retest i will scale down to the 5 Minute for Long entries. There has to be a Break of structure paired with a Demand push/ FVG and orderblock for me to enter for Longs. 1:3 RR Stops will be at the swing low. (Watch My 5 minute video for entry breakdown)
NQ - APRIL 8th Supply/Demand AnalysisNQ is on its retracement from previous week deep dive. I am currently looking for price to retrace and test previous resistance as support. Once it gives this retest i will scale down to the 5 Minute for Long entries. There has to be a Break of structure paired with a Demand push/ FVG and orderblock for me to enter for Longs. 1:3 RR Stops will be at the swing low.
Today analysis for Nasdaq, Oil, and GoldNasdaq
The Nasdaq closed lower after experiencing extreme volatility the previous day. Following a gap-down open, the market attempted a bottoming process. However, the spread of fake news related to tariffs triggered a 10% intraday swing, making the Nasdaq trade more like an individual stock than a major index. Massive trading volume occurred due to margin calls from CFDs and hedge funds, and the market showed some signs of recognition around a potential short-term bottom.
On the weekly chart, the index rebounded but was resisted at the 3-week moving average. On the daily chart, a doji bullish candlestick with strong volume formed, suggesting the market may attempt another rebound. However, since volatility from the bottom remains significant, if you’re planning to enter long positions, it's best to buy as close to the bottom as possible. If the market continues to form a base, a rebound toward the 5-day or 10-day moving average on the daily chart is possible.
On the 240-minute chart, the market is still in a death cross and remains oversold. Still, it's showing signs of forming a base around the 16,500 level, so it's better to avoid chasing short positions during any pullbacks that could form a double bottom. In this oversold environment, a buy-on-dip approach near the lows is favorable for a technical rebound. But since volatility remains high, make sure to set clear stop-loss levels for both long and short trades.
Crude Oil
Crude oil experienced a gap-down on the daily chart and closed lower after hitting resistance at the 3-day moving average. On both the daily and weekly charts, the $57–$59 zone appears to be a short-term support level. If the price dips into this zone, it may offer a buying opportunity. Yesterday’s candle was resisted at the 3-day line, so if a bottoming pattern forms today, a rebound toward the 5-day moving average could be anticipated. However, since the MACD has just issued a sell signal near the zero line, it's better to treat any long positions as short-term trades.
On the 240-minute chart, the sell signal is still valid, and the market remains in oversold territory. Watching for a potential double bottom formation before entering long positions is recommended. That said, if market sentiment continues to accept economic recession as a given, oil prices could keep falling. There's also the risk of a one-way downward move, so if you're going long, ensure tight stop-loss levels are in place.
Gold
Gold saw sharp volatility and closed lower after being rejected at the 5-day moving average. Due to the weaker dollar from U.S. tariff announcements, the attractiveness of gold has diminished in the short term. On the weekly chart, gold is still forming a range-bound movement near the 10-week moving average, with support appearing near the $2,975 level. On the daily chart, the lower Bollinger Band and the 60-day moving average are rising and beginning to converge.
These overlapping indicators could form a strong support zone, so if the price drops into this area, it may present a good opportunity to buy the dip. On the 240-minute chart, the MACD and signal lines have both dropped below the zero line, and the RSI has entered oversold territory.
While this could lead to further accelerated selling, it is also a zone where a rebound from oversold conditions could easily occur. It’s best to avoid chasing the downside and instead focus on buying during pullbacks near strong support zones.
Market volatility is increasing, but this is also a zone where technical rebounds are likely due to excessive declines. While confirmation of a bottoming pattern is needed, in this kind of market, it's safer to focus on one direction rather than trying to trade both ways.
Long positions currently offer a better risk-reward ratio, so it’s advisable to enter at the lower end of the range. Reduce leverage as much as possible and always set stop-loss levels to ensure safe trading in these turbulent conditions.
If you like my analysis, please follow me and give it a boost!
For additional strategies for today, check out my profile. Thank you!
NQ Power Range Report with FIB Ext - 4/8/2025 SessionCME_MINI:NQM2025
- PR High: 17753.75
- PR Low: 17644.50
- NZ Spread: 244.0
No key scheduled economic events
Volatility remains high with Trump tariff excitement
- Advertising rotation off previous session low
- Holding above the close below the high, inside Friday's range
- AMP margins temp increase remains
Session Open Stats (As of 12:45 AM 4/8)
- Session Open ATR: 627.37
- Volume: 48K
- Open Int: 272K
- Trend Grade: Bear
- From BA ATH: -21.4% (Rounded)
Key Levels (Rounded - Think of these as ranges)
- Long: 20954
- Mid: 19246
- Short: 16963
Keep in mind this is not speculation or a prediction. Only a report of the Power Range with Fib extensions for target hunting. Do your DD! You determine your risk tolerance. You are fully capable of making your own decisions.
BA: Back Adjusted
BuZ/BeZ: Bull Zone / Bear Zone
NZ: Neutral Zone
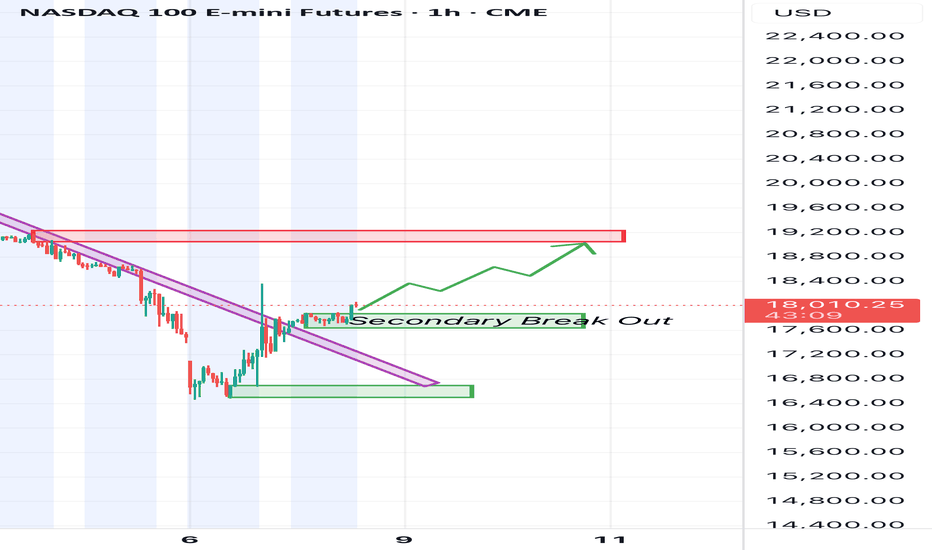
Watching For Consolidation, Correction or ContinuationWeekly:
Price took out old swing low after a lower low was printed — confirming bearish intent.
However, price is now inside a new HTF support zone.
MACD remains bearish, signaling potential continuation lower, but watch for possible slowdown or divergence signs in this zone.
Daily:
Structure is firmly bearish — lower low confirmed.
MACD bearish and showing momentum strength — favors continuation lower unless lower timeframes suggest a deeper correction.
4H:
Bearish convergence confirmed — price action aligns with HTF bearish bias.
However, current price action is corrective/bullish — likely a pullback within a bearish trend.
MACD still bearish but weakening — signals caution for late shorts, or potential for deeper retracement.
1H:
Monday's failure to make a new low overnight hinted early market structure shift — bullish correction in play.
MACD turned bullish into Friday's POC, and price rallied into 4H bearish imbalance above it.
Currently:
1H hidden bearish convergence developing — early sign correction may exhaust.
MACD weakening — signals reduced bullish momentum.
Key overnight scenarios:
Consolidation near current highs (distribution?)
Continuation of bullish correction into deeper supply
Bearish continuation if sellers step in aggressively from imbalance zone


