#202513 - priceactiontds - weekly update - nasdaq e-mini futuresGood Evening and I hope you are well.
comment: Last week I wrote that we need a proper channel down and the past week was the worst case scenario for the bulls. We could not even get to the 50% retracement and turned down violently again. There is a small chance for the bulls to make this a double bottom and go sideways but as of now that is very very low probability. More likely is that we have formed the top of the channel and will get a big second leg down to 18000 or lower. If we go down below 19000, my thesis is that we go down for 2 more weeks and then earnings will decide on the next impulse. For now the technicals are clear, market could not even retrace 50%, we turned around the daily 20ema and volume on the down move is picking up again. Everything points to a bear trend.
current market cycle: strong bear trend
key levels: 19000 - 20500
bull case: Bulls running for the exits. They have some previous support at the 2024-09 low 19073 but that is most likely not stopping this freight train down. Next big support is at 18000/18100 which is my W3 target. Only question now is if we find buyers tomorrow who want to keep the market above 19000. It’s not impossible that we could see 1-2 more days of stalling around 19000 but given the current structure the selling is just too strong to look for any longs.
Invalidation is below 19000.
bear case: Bears have now erased about a year of gains and we are heading lower. Friday was another strong sell signal and bears now want to close the monthly bar at the very low to also produce a huge sell signal on the weekly and monthly charts. The selling is strong enough for at least a decent sized second leg and the measured move leads to 16200 which is between my year-end-special target of 17500 and the bull trend line from the covid lows. Plan for the next 2 weeks is the W3 and W4 where I expect W3 to hit 18000 and W4 could retest 19000.
Invalidation is above 20600.
short term: Clear bear trend now once we drop below 19000. W3 should get us to around 18000 while W4 could be good for a retest of 19000. No longs for me what so ever. Big bear trend line from 22450 has to hold.
medium-long term - Update from 2024-03-16: My most bearish target for 2025 was 17500ish, given in my year-end special. Clear W1 of this bear trend. Market now has to close below 19000 to confirm W3. Depending on how deep W3 goes, W5 will either reach only around 17500 or the bull trend line around 16000.
current swing trade: None
chart update: Added most likely upper bear trend line and adjusted the 5-wave series.
UNF1! trade ideas

NQ weekly walkthrough and outlook for the next weekExpecting onesided displacement on NQ towards the sellside. Also we have NFP week.

NQ Swing Long Trade idea based on supply and demand, intermarket analysis, COT positioning and cross market valuation. Following a structured approach with clear entry, risk management, and confluence factors.

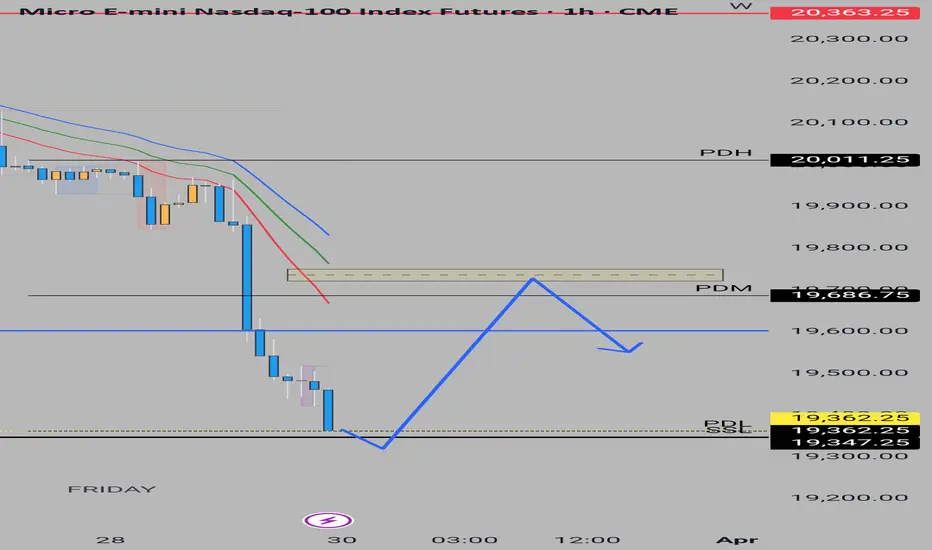
MNQ Monday AnalysisI see MNQ taking the very near low of MARCH 10th. After, I see it bullish most of the day on Monday back up to or near 19,735. Then a pullback to close Monday near 19,500.
NQ Swing Long Trade idea based on supply and demand, intermarket analysis, COT positioning and cross market valuation. Following a structured approach with clear entry, risk management, and confluence factors.

$NQ IdeaWhen analyzing the NQ weekly chart, we observe that the price has consumed internal liquidity in the premium region of the range and closed in a way that favors the continuation of the bearish movement. Given this, we believe the next **Draw on Liquidity** will be the weekly double bottom located just below.
However, since the market has experienced a sharp decline without corrections, there is a possibility of buying opportunities before the downtrend resumes. As we are in a discounted region on the weekly chart, the price may seek momentum toward the premium region, capturing **buyside liquidity** as fuel for the continuation of the bearish movement.
It is important to highlight that we must wait for the market to open and observe its initial movement to better define our trading strategy.

NQ Sitting at supportNQ actually dropped afterhours today, so now it's sitting right at support. It already dropped below the intraday support.
Keep an eye on it Monday

Nasdaq bearish we are not done in pain ...
More downside ahead.
We need to rebalance the markets and then 23000 / 24000 on NQ


Nasdaq Swing Trade – Bullish Setup with Strong FundamentalA confluence of fundamental and technical factors supports a long position on Nasdaq. COT data, retail positioning, seasonality, GDP, SPMI, inflation, and interest rates all align with a bullish outlook. Technically, price is in a discounted zone relative to the monthly low’s anchored VWAP, presenting an optimal long entry within the overall bullish trend. My target levels are set based on risk-reward principles, aiming to capture trend continuation if momentum sustains.

Nasdaq Futures Potential Short OpportunitiesThe Nasdaq Futures' brief rebound from the critical 19345 support was decisively rejected at 20458, marking a continuation of bearish sentiment.
Current Scenario: Now, testing immediate support at 19857 failure here opens the pathway downward to subsequent supports at 19716 and 19646, ultimately retesting the critical low at 19345.
Resistance Levels: Clear resistance lies at 20458. Breaking this could temporarily shift sentiment but faces significant challenges amid rising volatility.


NQ Power Range Report with FIB Ext - 3/28/2025 SessionCME_MINI:NQM2025
- PR High: 20011.75
- PR Low: 19983.25
- NZ Spread: 63.5
Key scheduled economic events:
08:30 | Core PCE Price Index (MoM|YoY)
Holding value in the weekend gap range at previous session close
- Daily rotation short out of the Keltner average cloud, 20400-600 range
Session Open Stats (As of 12:55 AM 3/28)
- Session Open ATR: 421.56
- Volume: 22K
- Open Int: 233K
- Trend Grade: Neutral
- From BA ATH: -11.7% (Rounded)
Key Levels (Rounded - Think of these as ranges)
- Long: 20954
- Mid: 19814
- Short: 18675
Keep in mind this is not speculation or a prediction. Only a report of the Power Range with Fib extensions for target hunting. Do your DD! You determine your risk tolerance. You are fully capable of making your own decisions.
BA: Back Adjusted
BuZ/BeZ: Bull Zone / Bear Zone
NZ: Neutral Zone

powellstanding way back, the nasdaq is looking horrible... i thinks augs low will hold for a bounce back up... i think current ath will be in for awhile....... we have our 61.8% fib retracement down at 15k for a possible swing to new aths! macro cup and handle aswell and macro abcs riding beautifully along our band... ofc this is just skepticism on a 1 day chart... it will take MAJOR news for a push near 15k

2025-03-27 - priceactiontds - daily update - nasdaqGood Evening and I hope you are well.
comment: Many potential trend lines that market could respect tomorrow. We are in an expanding triangle, a broad bull channel and the big bear trend on the daily chart. No idea what we get tomorrow so I lean neutral around 20000.
current market cycle: strong bear trend but currently in W2 (above 20700 that thesis drops to a 50/50 chance)
key levels: 19600 - 20700
bull case: Bulls surprised me with the huge buying around 20000. Yesterdays selling was good enough to expect lower prices, so stopping at 20000 wasn’t what I hoped for. Bulls turned the market neutral and if they continue with higher highs above 20200, they could get a breakout to 20400 or 20500. My w2 target still remains 20700. Past 50 trading ranges range is 19600 - 20500 and 50% of it is 20060 and we are at 20004. Good enough. Market is in balance.
Invalidation is below 19600.
bear case: Bears printed consecutive bear bars on the 4h chart but they barely make new lows on them. We could see a strong move below 20000 but for now I would need a strong signal and follow-through before I join the bears below 20000. I also think most bears will give up above 20200 and wait for market to get closer to 300 or 400 again. Daily chart shows it the best. We just closed the gap from Monday and market is now free to do whatever.
short term: Neutral 20000. Bears are slightly favored to continue the bigger bear trend but as of now, selling around or below 20000 does not make sense.
medium-long term - Update from 2024-03-16: My most bearish target for 2025 was 17500ish, given in my year-end special. We don’t know if we have printed the W1 of the new bear trend or repeat the pattern from 2024, where we sold of very strong to reverse even more strongly and make new all time highs. Market needs a bounce and around 20000/20500 we will see the real battle for the next weeks.
trade of the day: Tough day if you are not comfortable with trading ranges and it was absolutely not clear that we get a range-bound day. Bull reversal from the US open was likely the best trade since it was very strong without much uncertainty.

Trend Reversal in Play?After a strong bearish channel that lasted several weeks, the market has finally broken out of the resistance level — a key technical signal. This breakout was followed by higher lows and higher highs, suggesting a possible shift in momentum. 📈
Volume has also increased noticeably around the breakout zone, which can signal stronger conviction from buyers. The question now is: Are we entering a new uptrend?
As long as the price holds above the broken resistance (now acting as support), bulls could take control. Traders should keep an eye on key support zones and potential continuation patterns to confirm the trend reversal.
👉 What do you think — new rally or a bull trap?

NQ: 161st trading session - recapA more indepth post about my session, my journaling has been pretty bad recently that's why I gotta pick it up again.
Also I found out how I can enjoy my sessions 10x more: coffee, I'm usually just tired cause of sports and school, this not only makes it more enjoyable but I'm also way more locked in. Coffee might actually be the secret revolutionary trading strategy everyones been looking for.

Strong bullish outlook for the E-mini Nasdaq-100 (NQM2025)Nasdaq-100 E-mini Futures (NQM2025) – Technical & Fundamental Analysis
Technical Overview:
My Daily chart analysis on TradingView highlights a strong bullish outlook for the E-mini Nasdaq-100 (NQM2025). Here are the key takeaways:
Liquidity Sweep & Support Retest:
The recent decline led to a liquidity sweep (LQ SWEEP) at a critical ascending trendline. This suggests a classic stop-hunt scenario where weaker long positions were liquidated before stronger buyers stepped in.
Historical price action indicates that buyers previously entered at similar levels (noted as "Buyers coming in hot here"), reinforcing this demand zone.
Bullish Trendline Respect:
The long-term ascending trendline has been respected, acting as a dynamic support level.
The recent bounce suggests that this level remains intact, further validating the bullish structure.
Order Block (OB) & Market Structure Shift (MSS):
A previous bearish market structure shift (MSS) led to a short-term decline, but price has since found support and rebounded.
The chart suggests a reversion to the upside, targeting prior imbalance zones and liquidity pockets.
Projected Path & Targets:
The green projection indicates an expectation of higher highs, likely targeting the 21,500 - 22,500 range in the coming weeks.
The sell-side liquidity has been cleared, increasing the probability of a bullish move towards the order block resistance near 21,000.
Fundamental Confirmation (#EdgeFinder & #COT Data):
From a fundamental perspective, the bullish bias is further confirmed by EdgeFinder data and recent Commitment of Traders (COT) reports:
Institutional Positioning:
The latest COT data shows that institutional traders have increased their net long positions in Nasdaq futures, signaling bullish sentiment.
Macroeconomic Factors:
Recent economic reports and Fed statements have favored a risk-on environment, benefiting tech-heavy indices like Nasdaq.
Earnings season is approaching, with expectations of strong tech sector performance potentially fueling further upside.
Conclusion & Market Sentiment:
The confluence of technical support, institutional buying, and positive macroeconomic factors strengthens the case for a bullish continuation in Nasdaq-100 futures.
The key level to watch is 20,000—if held, the probability of a move towards 21,500 - 22,500 increases significantly.
Risk factors include unexpected macroeconomic shifts or stronger-than-expected hawkish Fed rhetoric, which could slow momentum.
This is not financial advice, only data analysis. Please consult a qualified financial professional for personalized guidance.

Long Position NQLong Position NQ
SL: Swing low
TP: FE 0.618
Size based on your risk management strategy


High Probability Long Position NQHigh Probability Long Position NQ
TP: FE 1.27
SL: Swing Low
Size based on your risk management strategy

High Probability Long Position NQHigh Probability Long Position NQ
SL: Swing Low
TP: FE 1.618
Size based on your risk management strategy

High Probability Short Position NQTP: FE 4.618
SL: Swing high
Size based on your risk management strategy
