NQ Power Range Report with FIB Ext - 3/12/2025 SessionCME_MINI:NQH2025
- PR High: 19479.75
- PR Low: 19399.25
- NZ Spread: 180.0
Key scheduled economic events:
08:30 | CPI (Core|YoY|MoM)
09:30 | Crude Oil Inventories
13:00 | 10-Year Note Auction
Previous session closed practically unchanged following wide value swings
- Auctions continues to hold Monday's lows
- Inventory low declined to 19200, advertising rotation above 19690
Session Open Stats (As of 12:35 AM 3/12)
- Session Open ATR: 482.56
- Volume: 30K
- Open Int: 292K
- Trend Grade: Neutral
- From BA ATH: -13.2% (Rounded)
Key Levels (Rounded - Think of these as ranges)
- Long: 22667
- Mid: 21525
- Short: 19814
Keep in mind this is not speculation or a prediction. Only a report of the Power Range with Fib extensions for target hunting. Do your DD! You determine your risk tolerance. You are fully capable of making your own decisions.
BA: Back Adjusted
BuZ/BeZ: Bull Zone / Bear Zone
NZ: Neutral Zone
UNF1! trade ideas

MNQ!/NQ1! Day Trade Plan for 03/11/2025MNQ!/NQ1! Day Trade Plan for 03/11/2025
📈19470 19560
📉19380 19285
Like and share for more daily NQ levels 🤓📈📉🎯💰
*These levels are derived from comprehensive backtesting and research and a quantitative system demonstrating high accuracy. This statistical foundation suggests that price movements are likely to exceed initial estimates.*

MNQ!/NQ1! Day Trade Plan for 03/10/2025MNQ!/NQ1! Day Trade Plan for 03/10/2025
📈20040 20140
📉19760 19665
Like and share for more daily NQ levels 🤓📈📉🎯💰
*These levels are derived from comprehensive backtesting and research and a quantitative system demonstrating high accuracy. This statistical foundation suggests that price movements are likely to exceed initial estimates.*


NQ: 153rd trading session - recapI missed my session yesterday because for March the times are off by 1h - I obviously did NOT realise that...
Good session, I gotta start taking more confluences like the one marked on the chart...

Nasdaq (March 2025) - Aiming For Low Hanging FruitsAs we have seen a recent delivery through a higher timeframe Sellside liquidity pool @ 20248.75 as well as tagging the weekly bullish order block @ 20011.25 I am not really seeing any signatures on this timeframe to suggest that Nasdaq is bullish at the moment.
However, on the lower timeframes, there is a potential for Nasdaq to attack premium PD arrays before reversing and continuing it's bearish trend.
I want to see the highs for the week created by Wednesday latest.
Sunday gap opening will determine the likelihood of this bias delivering

NQ Long (03-11-25)NAZ is at U Turn #2 and third triangle Key Level. You would think we would see a bounce as we are 13% from ATH and 13% from 2024 Open Price. Follow KL's lower for support or look for any bounce 1st, then to stall and drop. NAZ has no strength and much of the prior strength (past few years) came in the O/N (overnight). BTD/FOMO's are on at the Tiki Bar on Spring Break. Just a classic pump/dump, they aren't even hiding it.

SELL ON NAS (FUTURES OR INDICES)we have finally broken another level as nas continues to drop. we had a nice bullish engulfing holding up the support which finally was broken giving us a solid entry ... the targets are set and let the trade play out

Fractality in Trading: the market’s hidden patternHave you ever noticed how price movements look similar across different timeframes? This is Fractality in Trading, a concept that suggests markets behave in repeating patterns regardless of scale.
In the chart above, we compare the 1-Day (left) vs. 1-Week (right) timeframe for NASDAQ 100 Futures. Despite the difference in time horizons, the price movements, corrections, and trend reversals mirror each other, following the same wave structures.
What Does This Mean for Traders?
✔️ Price Action Repeats Itself: Market cycles—uptrends, downtrends, and consolidations—occur in similar ways across different timeframes.
✔️ Multi-Timeframe Analysis (MTA): By analyzing a higher timeframe (1W), traders can identify key trends and use the lower timeframe (1D) for precision entries.
✔️ Scalability: Whether you are a swing trader, day trader, or long-term investor, the same patterns apply, making technical analysis universally effective.
Key Takeaway
Understanding fractality helps traders align their trades with the dominant trend, reducing false signals and improving trade confidence.
Do you use multi-timeframe analysis in your strategy? Let me know in the comments!

$1,000+ Profit on NQ with this one tradeGive this post a like and if we get it to 100 likes I will post on my YT the entry to this trade as well as an explanation as to why I entered here.
Forex, Crypto and Futures Trading Risk Disclosure:
The National Futures Association (NFA) and Commodity Futures Trading Commission (CFTC), the regulatory agencies for the forex and futures markets in the United States, require that customers be informed about potential risks in trading these markets. If you do not fully understand the risks, please seek advice from an independent financial advisor before engaging in trading.
Trading forex and futures on margin carries a high level of risk and may not be suitable for all investors. The high degree of leverage can work against you as well as for you. Before deciding to trade, you should carefully consider your investment objectives, level of experience, and risk appetite.
There is a possibility of losing some or all of your initial investment, and therefore, you should not invest money that you cannot afford to lose. Be aware of the risks associated with leveraged trading and seek professional advice if necessary.
BDRipTrades Market Opinions (also applies to BDelCiel and Aligned & Wealthy LLC):
Any opinions, news, research, analysis, prices, or other information contained in my content (including live streams, videos, and posts) are provided as general market commentary only and do not constitute investment advice. BDRipTrades, BDelCiel, and Aligned & Wealthy LLC will not accept liability for any loss or damage, including but not limited to, any loss of profit, which may arise directly or indirectly from the use of or reliance on such information.
Accuracy of Information: The content I provide is subject to change at any time without notice and is intended solely for educational and informational purposes. While I strive for accuracy, I do not guarantee the completeness or reliability of any information. I am not responsible for any losses incurred due to reliance on any information shared through my platforms.
Government-Required Risk Disclaimer and Disclosure Statement:
CFTC RULE 4.41 - HYPOTHETICAL OR SIMULATED PERFORMANCE RESULTS HAVE CERTAIN LIMITATIONS. UNLIKE AN ACTUAL PERFORMANCE RECORD, SIMULATED RESULTS DO NOT REPRESENT ACTUAL TRADING. ALSO, SINCE THE TRADES HAVE NOT BEEN EXECUTED, THE RESULTS MAY HAVE UNDER-OR-OVER COMPENSATED FOR THE IMPACT, IF ANY, OF CERTAIN MARKET FACTORS, SUCH AS LACK OF LIQUIDITY. SIMULATED TRADING PROGRAMS IN GENERAL ARE ALSO SUBJECT TO THE FACT THAT THEY ARE DESIGNED WITH THE BENEFIT OF HINDSIGHT. NO REPRESENTATION IS BEING MADE THAT ANY ACCOUNT WILL OR IS LIKELY TO ACHIEVE PROFIT OR LOSSES SIMILAR TO THOSE SHOWN.
Performance results discussed in my content are hypothetical and subject to limitations. There are frequently sharp differences between hypothetical performance results and the actual results subsequently achieved by any particular trading strategy. One of the limitations of hypothetical trading results is that they do not account for real-world financial risk.
Furthermore, past performance of any trading system or strategy does not guarantee future results.
General Trading Disclaimer:
Trading in futures, forex, and other leveraged products involves substantial risk and is not appropriate for all investors.
Do not trade with money you cannot afford to lose.
I do not provide buy/sell signals, financial advice, or investment recommendations.
Any decisions you make based on my content are solely your responsibility.
By engaging with my content, including live streams, videos, educational materials, and any communication through my platforms, you acknowledge and accept that all trading decisions you make are at your own risk. BDRipTrades, BDelCiel, and Aligned & Wealthy LLC cannot and will not be held responsible for any trading losses you may incur.

Daily Outlook 11.03.2024 (The most important levels...)Here we can see the NWOG, NDOG, Yesterdays LOD & HOD and The LOD from friday. If we hit that, it would be an immediate rebalance on the daily chart, which is pretty strong!

NQ Power Range Report with FIB Ext - 3/11/2025 SessionCME_MINI:NQH2025
- PR High: 19461.50
- PR Low: 19370.25
- NZ Spread: 204.0
Key scheduled economic events:
10:00 | JOLTS Job Openings
Value decline continues, finding 19200s inventory
- Advertising continued selling, keeping slight gap above previous session high open
- Holding auction above previous session close at the lows
Session Open Stats (As of 12:35 AM 3/11)
- Session Open ATR: 498.26
- Volume: 83K
- Open Int: 297K
- Trend Grade: Neutral
- From BA ATH: -13.2% (Rounded)
Key Levels (Rounded - Think of these as ranges)
- Long: 22667
- Mid: 21525
- Short: 19814
Keep in mind this is not speculation or a prediction. Only a report of the Power Range with Fib extensions for target hunting. Do your DD! You determine your risk tolerance. You are fully capable of making your own decisions.
BA: Back Adjusted
BuZ/BeZ: Bull Zone / Bear Zone
NZ: Neutral Zone

Nasdaq Potential Huge BounceI post this again, because from my last post, some only see a confusing picture instead of the chart.
Price nearly reached the L-MLH of the Red Fork.
This is a huge price stretch and chances are super high that we will see a big bounce to the upside.
As for PTG's I focus on the Red, and the Orange Centerline.

NQ Daily Update - RSI and MFI oversoldThe last time daily indicators went this oversold on NQ is when the Fed raised rates. The market did bounce up though as you can see with the overlay.
As I stated on the ES chart, futures left an open gap last night and I expect that to fill. Expecting a bounce soon, just not sure when, lol.
I think it's safe to buy ETFs and stocks for the bounce, but be careful with call options. Given the premium, timing will need to be more precise.

Bears in Control, but Oversold Signals Hint at Squeeze RiskThe break of uptrend support dating back to the start of the artificial intelligence (AI) frenzy in early 2023 may embolden Nasdaq 100 bears to seek a far larger downside unwind than what’s already been seen. Coming on the back of last week’s disintegration of the 200DMA—and with valuations still stretched relative to historic averages while competition in the AI space from China seemingly grows by the day—the technical and fundamental ducks are lining up for such an outcome.
While recent price action has been entirely bearish, sustained directional moves rarely unfold without the occasional countertrend interruption. With RSI (14) now in oversold territory on the daily timeframe and Nasdaq 100 futures finding some buyers between minor support at 19300–19140, this may provide a platform for some form of countertrend squeeze.
If bids continue to repel bears on dips beneath 19,300, longs could be established above the level with a stop below 19140 for protection against a continuation of the prevailing bearish trend. Former uptrend support sits just below 19,900 and looms as a potential trade target. Alternatively, if the price breaks through 19,140 convincingly, bears may set their sights on support at 18,387.
Patience may be required for those considering the setup. Watching USD/JPY for signs of capital flight back into the yen may also be advisable given the skittish environment.
Good luck!
DS

2025-03-10 - priceactiontds - daily update - nasdaq e-mini
Good Evening and I hope you are well.
comment: Strongest bear bar after a 11 bar bear micro channel on the daily chart, that broke below the big bull trend line. I will never see this as even more bearish. Much more likely is that we are very close to an intermediate bottom and squeeze shorts big time. Only looking to long this. After a decent bounce we can talk lower targets again.
current market cycle: trading range - only daily closes below 20000 mark the end of this bull trend
key levels: 19000 - 21000
bull case: Bulls have to trap bears here or we will go for 19000 or even 18867 (2024-09 low) tomorrow. Bulls do not have many arguments until they produce better buying pressure. Every small rip is sold and market stayed below the 15m 20ema the whole day after it broke below it early in EU session. Bulls must claim 19600 for further upside and next would be weekly open at 19668. If bulls get above 19700, I think most bears will give up and wait for 20000 and either of the bear trend lines to be hit before shorting again.
Invalidation is below 19250.
bear case: Below 19250 we most likely go for 19000 or even 19668. Bears are still in full control but the selling is so overdone and climactic and any bigger bounce will likely do for this to completely melt much higher before bears join again. What are the odds of bears just falling through the multi-year bull trend line and keep going? Very. Very. Low. Not impossible but certainly nothing I would bet money on. For now it’s likely best to wait an see if bulls get make higher highs. If I had to guess I’d say we could have seen the lows today but it’s pure guesswork. Shorts make no sense down here and I will only look for longs for at least 19800.
Invalidation is above 20200.
short term: Can only be neutral for now. Having a bullish bias but bulls are not doing enough for now. I wait. 20k is my first target.
medium-long term - Update from 2024-02-23: Neutral since we are in a 4-5 month trading range. Still leaning heavily bearish for this year but for now it’s sideways until we get consecutive daily closes below 20000.
trade of the day: Shorts once market broke below 20000 and failed to get above it again.

NASDAQ – Will It Hold or Collapse Further?📉🔥 NASDAQ Approaching Max Pain – Will It Hold or Collapse Further? 🚀⚠️
The NASDAQ 100 is hanging by a thread, as price approaches the key 19,106 support level. A breakdown from here could accelerate losses toward the 18,283 zone, and if things get worse, the dreaded 16,732 "Max Pain" level may be tested.
📊 Key Technical Levels:
📌 19,106 – First major support (bounce or breakdown zone).
📌 18,283 – Next key level if sellers take control.
📌 16,732 – The "Max Pain" zone, where long-term buyers may step in.
📌 15,347 – Ultimate demand zone if things spiral out of control.
🚨 Why Is Nasdaq Falling?
Tech stocks are getting destroyed, with Tesla leading the plunge.
Market panic over higher interest rates & economic uncertainty.
Bitcoin also struggling, highlighting broader risk-off sentiment.
💡 Will we see a relief rally from these levels, or is the bloodbath just getting started?
Drop your thoughts below!
One Love,
The FXPROFESSOR 💙
#Nasdaq #StockMarketCrash #TechStocks #Trading #MarketAnalysis

NQ Range (03-10-25)Going back to Daily Post updates from weekly, during these very fun times (selling is back). I would not count of a Gap move at Sunday O/N open. No gap, look for 1st move set up with counter move as larger move. KL's to watch 20,470 Upper & 19,874 Lower. Blue shaded zone is sideways or Upper KL rejection pull back zone / Lower KL support lift zone. White SZ (near Turd KL) may be the weekly sideways play and set up for next move lower (should it not breakout up). Sellers need buyers in order to exit, since 2/21 NQ volume has basically doubled (mostly selling or the addition of selling). The battle will increase so expect some off session (long side) Rig tricks & treats. Let's see the GAP Open to start this one out.

Market Markets are bearish with talks of ww3 and further economic tension surrounding Russia Ukraine. While USA is economy is pulling back before it can go forward. Expecting rebound to these levels. Will Trumps new tarriffs work? We will see!

Double Bottom pattern: A bullish reversal signal The Double Bottom pattern is a classic reversal formation that signals a potential trend change from bearish to bullish. It occurs after a prolonged downtrend when price forms two distinct lows at a similar level, indicating strong support.
How to Identify:
✔️ Two Lows: Price touches the same support level twice, forming a "W" shape.
✔️ Resistance Breakout: The neckline (resistance level) marks the breakout zone.
✔️ Trend Reversal Confirmation: Once price breaks above resistance, momentum shifts bullish.
Interpretation:
In this chart, we see a clear bearish trend, followed by two attempts to break below the same support level.
After failing to break lower, buyers regained strength, pushing price above resistance, confirming the bullish reversal.
Once resistance turns into support, traders often enter long positions, targeting higher levels.
What’s Next?
A sustained breakout could fuel further upside momentum. However, watch for potential false breakouts and retracements back to support before continuation.

Nasdaq - Potential Huge Bounce AheadPrice nearly reached the L-MLH of the Red Fork.
This is a huge price stretch and chances are super high that we will see a big bounce to the upside.
As for PTG's I focus on the Red, and the Orange Centerline.

MNQ!/NQ1! Day Trade Plan for 03/07/2025MNQ!/NQ1! Day Trade Plan for 03/07/2025
📈20328 20420 20515
📉19860 19765
Like and share for more daily ES/NQ levels 🤓📈📉🎯💰
*These levels are derived from comprehensive backtesting and research and a quantitative system demonstrating high accuracy. This statistical foundation suggests that price movements are likely to exceed initial estimates.*

NASDAQ Futures Fall Following S&P's Worst Week Since SeptemberUS stock futures fell solidly Monday as investors and traders took the weekend to process the February jobs report and prepared for a busy week of economic data, headlined by a report on inflation amid concerns over its resurgence under President Trump's unpredictable trade policy.
Dow Jones Industrial Average futures (YM=F) fell 1%, while futures attached to the benchmark S&P 500 (ES=F) also dropped 1% after the index posted its worst week since September. Futures tied to the Nasdaq (NQ=F) also slipped around 1.79%.
All three major indexes looked set to build on losses of more than 2% last week.
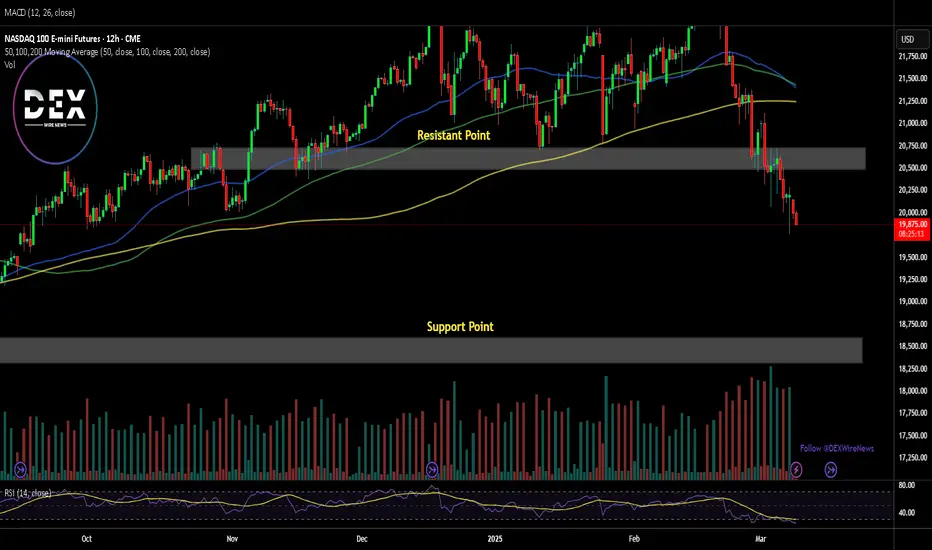
For the Nasdaq Composite, the resistance point has been faded with selling pressure increasing, the 18,500 point could serve as support point for Nasdaq price index. However, should a trend reversal occur, the break above the resistant pivot may catalyse a bullish spree as industries, investors and traders are dissecting President Trump's trade policy.