Nasdaq Leading Equities HigherThe equity markets are seeing higher prices today with the Nasdaq leading the way higher trading up near 2.5% on the day while the S&P and Russell both traded over 1% as well. There was steep selling pressure in equities to end the week last Friday due to additional tensions in the Middle East, and the markets are seeing a strong rebound today, especially on the technology front. While the equities were strong today, Crude Oil had the opposite effect, with a strong push higher on Friday and strong selling pressure on the session today trading down near 2.5%.
Looking ahead for the week, the big ticket item will be the Fed Meeting and interest rate decision on Wednesday the 18th, where the market is pricing in another pause on interest rates. Looking at the CME Fed Watch Tool, it is pricing in the first rate cut of the year to come in September at a 56% probability, which has continued to get pushed back later into the year with all of the uncertainty and volatility in the market. Traders will be more concerned with Fed Chair Powell’s remarks after the decision about the future plans of the Fed for the remainder of the year.
If you have futures in your trading portfolio, you can check out on CME Group data plans available that suit your trading needs tradingview.com/cme/
*CME Group futures are not suitable for all investors and involve the risk of loss. Copyright © 2023 CME Group Inc.
**All examples in this report are hypothetical interpretations of situations and are used for explanation purposes only. The views in this report reflect solely those of the author and not necessarily those of CME Group or its affiliated institutions. This report and the information herein should not be considered investment advice or the results of actual market experience.
UNF1! trade ideas

Nasdaq Seek and Destroy. Play Patience Game.Patience.
both bullish and bearish idea are valid.
We're ahead of FOMC of tomorrow and we might get false movements / remain under range.
better to no try to rationalize the market here but rather let it showcase his will first.

NQ London Silver Bullet Time WIndowTurtle Soup NQ London target Monday Asian Low. Paper Trading. Reversal After Daily FVG H.

Are we about to see historic highs on the markets?Are we about to see historic highs on the markets?
In my previous article, I predicted that the trade war would soon be over and that the markets would resume their growth. This is exactly what is happening. I believe that stocks have bottomed out and I am positioning myself very bullishly ahead of the summer. Investors now have the opportunity to buy quality stocks at lower prices and use appropriate tools to make purchases at the right price. Maintaining calm during periods of market turbulence is of paramount importance.
The stock market always tends to grow in the long term and, thanks to the intervention of central banks and sometimes governments, manages to overcome moments of deep crisis. This was the case during significant events such as the attack on the Twin Towers in 2001, the Lehman Brothers crisis in 2008, and the Covid period in March 2020.
This dynamic is intrinsic to the history of the market itself. If you take a 20- or 30-year view of any major stock index, this trend is visible.
Therefore, although recent market declines may appear volatile or steep, they are not particularly serious in the context of the long-term trend, provided you have the time and ability to remain calm while waiting for the situation to stabilize.
Immagine
These moments can present buying opportunities for high-quality technology stocks that were previously expensive.
Despite the uncertainty, there are select opportunities when considering companies that continue to innovate by reinvesting their profits in research. These companies tend to emerge stronger from periods of crisis, especially if they have little debt and a loyal customer base.
This is particularly relevant for companies developing artificial intelligence and cloud infrastructure, such as Nvidia, Google Alphabet, and Microsoft Corp. Although these companies are not immune to cyclical difficulties, they continue to innovate internally.
Some companies, while not distributing dividends to shareholders, reinvest all their profits in equity and technological research. Now we will examine what, in my opinion, is the best index to invest in for the summer. It is well known that one of the Trump administration's main goals is to weaken the dollar, and this dynamic is indeed underway.
A weakening dollar has significant effects on American companies, with varying consequences depending on the sector and their exposure to global markets.
It is well known that a devaluation of the dollar leads to improved export competitiveness. Companies that sell products abroad benefit from a weaker dollar because their goods become cheaper for foreign customers, increasing demand and profits. This phenomenon favors industries such as technology, aerospace, and agriculture.
Immagine
The indices we will focus on for the summer are the Nasdaq US TECH 100 and the S&P 500, US 500. Technology companies benefit from a weaker dollar thanks to exports. In general, as I often say, large American companies with strong international revenues tend to benefit from a weak dollar, as foreign revenues increase in value when converted into dollars.
It is well known that Nvidia, Microsoft, and Apple shares have a significant influence on this index. A weak dollar can boost the profits of companies that generate a substantial portion of their revenues abroad, such as the companies mentioned above. As a result, the rise in these stocks could lead the indices to reach new all-time highs.
From a technical standpoint, chart analysis supports my purchases on the major US indices. Recent gains are in fact supported by above-average volumes, and prices remain above the 200-period moving average.
In addition, the latest news is positive. As expected, the trade war was short-lived, and the US and Europe have also reached an agreement on 10% tariffs.

NQ Power Range Report with FIB Ext - 6/17/2025 SessionCME_MINI:NQU2025
- PR High: 22177.25
- PR Low: 22065.25
- NZ Spread: 250.25
Key scheduled economic events:
08:30 | Retail Sales (Core|MoM)
Contract rollover week
Session Open Stats (As of 12:45 AM 6/17)
- Session Open ATR: 385.81
- Volume: 47K
- Open Int: 178K
- Trend Grade: Neutral
- From BA ATH: -3.5% (Rounded)
Key Levels (Rounded - Think of these as ranges)
- Long: 22096
- Mid: 20383
- Short: 19246
Keep in mind this is not speculation or a prediction. Only a report of the Power Range with Fib extensions for target hunting. Do your DD! You determine your risk tolerance. You are fully capable of making your own decisions.
BA: Back Adjusted
BuZ/BeZ: Bull Zone / Bear Zone
NZ: Neutral Zone

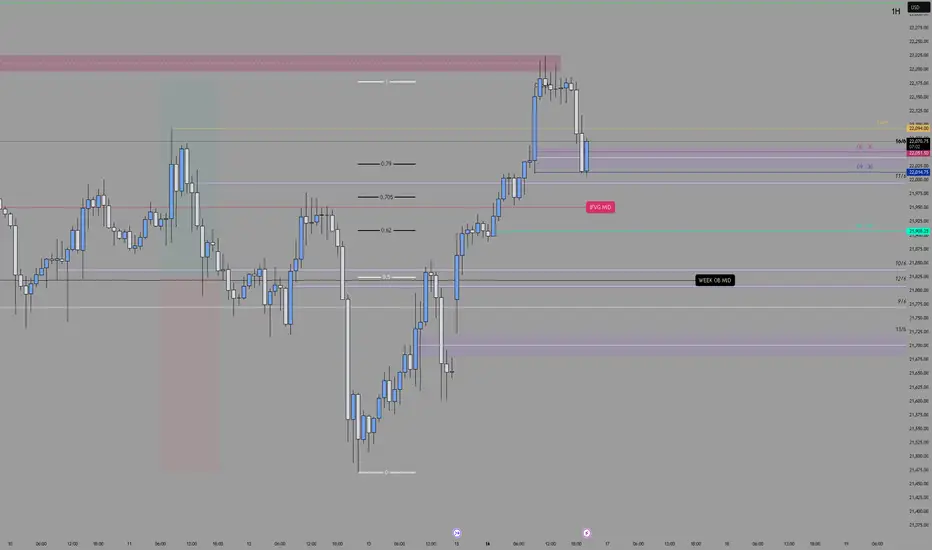
New Dealing Range in HTFAs I Expect The Po3 in my previous analysis and it perfectly projected after that price retraced with daily volume imbalance and tryin to come down...also I found a new dealing range on 4Hr
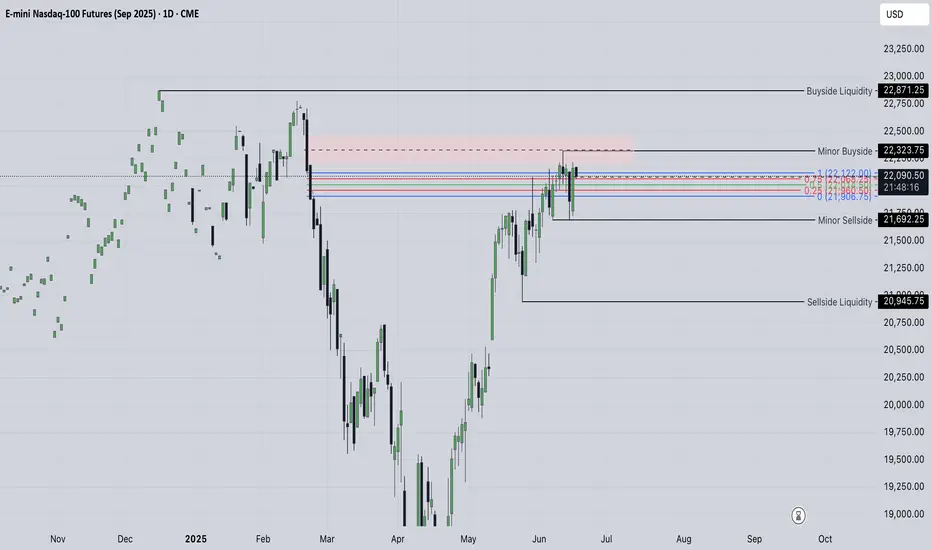
NQ studyI am quite sure the sharp move is coming... which way will it happen we will see, for longer term positions there are no reasonable entries, so once we get a breakout of this distribution or consolidation either way we are likely to see the bigger traders joining along which will accelerate the movement, so far we are looking bullish and ld like to see prices remain above the measured imbalance from 24th of february and its 50 % level, as well as going higher should let us overtake the pink imbalance positioned higher and the minor buyside though we have already received the rejection from that area.
in this case
Looking for sellside delivery first of all I am interested in the minor sellside (20945) as we have formed the equal lows down there, breaking this level will likely put us in shorts for a period of time receiving so called correction to the upward movement we had.
Conditions For A Pullback In The NASDAQ 100 Are PresentAll the conditions for a reversal in the NASDAQ 100 appear to be in place, but just because these conditions are present doesn’t mean a reversal must occur. The most obvious condition is the presence of a rising wedge, which formed over the past month and broke on Friday. Whether this pattern entirely unfolds remains to be seen, but there is supporting evidence suggesting it may.
Momentum, as measured by the Relative Strength Index, has clearly been trending lower since peaking on May 19, even as the price of the NASDAQ 100 has continued to rise—a classic bearish divergence.
Over the same period, we’ve observed the NASDAQ rising on decreasing levels of volume—another characteristic of a rising wedge pattern. Then, on Friday, the index broke below the lower boundary of the wedge. The wedge measures approximately 7% from its bottom to the top, suggesting that if the pattern fully plays out, the NASDAQ could decline back to around 20,350. It is also worth noting that there is a gap on the chart at 20,150, which could potentially be filled during such a pullback.
However, that doesn’t mean a decline will be straightforward, because, for now at least, the NASDAQ has found support at the 20-day moving average at 21,514. The NASDAQ will therefore need to break through this strong support level for a deeper decline to occur. In fact, the NASDAQ has not traded below its 20-day moving average since April 23.
While all the conditions for a break from the NASDAQ’s rising wedge are present and appear on the verge of unfolding, the market still has much to prove before the bearish scenario can fully materialize.
Written by Michael J. Kramer, founder of Mott Capital Management.
Disclaimer: CMC Markets is an execution-only service provider. The material (whether or not it states any opinions) is for general information purposes only and does not take into account your personal circumstances or objectives. Nothing in this material is (or should be considered to be) financial, investment or other advice on which reliance should be placed.
No opinion given in the material constitutes a recommendation by CMC Markets or the author that any particular investment, security, transaction, or investment strategy is suitable for any specific person. The material has not been prepared in accordance with legal requirements designed to promote the independence of investment research. Although we are not specifically prevented from dealing before providing this material, we do not seek to take advantage of the material prior to its dissemination.

E-mini Nasdaq-100 Trading Setup for sellers ^)We have completed cup and handle pattern here...
So after the price is still high!
We may see some price gain additional, something like 13-18% .
So we have two option here for the sellers, wait and sell from marked point 1 or 2 .
P.S. This is very long time range position. ( Something like 200-800 day ).
Have a profit in your day!
Thanks.

Weekly Market Outlook: FOMC, Trade Deals and GeopoliticsIt is a holiday-shortened week, with the majority of markets halting early on Thursday, June 19, 2025, in observance of Juneteenth. See here for holiday trading schedule
Key Themes to Monitor This Week
Geopolitical Risks
Any outside intervention in the ongoing Israel-Iran conflict will likely be seen as a risk-off event by market participants. Despite Friday’s sell-off, markets shrugged off during the Sunday open and overnight sessions.
There are potential risks to trade routes and energy infrastructure, although disruptions seem unlikely at the moment. Amena Bakr at Kpler noted that, so far, there are no signs of disruptions in oil loadings from Iran. Without a supply outage, there is no pressing need for additional barrels to be brought onto the market.
Trade War and Trade Deals
There have been recent developments with the U.S. reaching key trade deal milestones with several countries. The baseline scenario remains optimistic, with expectations for an extension in negotiations and potential reciprocal tariffs for countries failing to reach agreements.
FED Week
This is a key week for U.S. monetary policy, with the FOMC decision, Summary of Economic Projections (SEP), and Chair Powell’s press conference scheduled.
Traders will be closely watching how the Fed’s inflation and growth expectations have evolved, as reflected in the SEP. All eyes will be on the dot plot to note how interest rate expectations have evolved since last quarter. Of note: Will President Trump’s continued calls for rate cuts influence Chair Powell’s tone or guidance?
Expectations for the Week Ahead
NQ futures have continued one-time framing higher, consistently creating higher lows since the week of April 21, 2025. A strong support zone exists below, anchored at the yearly Volume Point of Control (VPOC) and the Anchored VWAP from May 11, 2025, when markets gapped higher.
Key Levels to Watch
• yVAH: 22,690.50
• R2: 22,510
• R1 / Previous Week High: 22,322.50
• May 11 AVWAP: 21,672.25
• yVPOC: 21,660
Scenario 1: Market Grinds Higher but Stays Cautious
Despite several looming risk factors, the market could continue to grind higher. In this scenario, we anticipate a test above the prior week's high, followed by a potential pullback into last week’s range.
Example Trade Idea 1
• Entry: 22,000
• Stop: 21,930
• Target: 22,322
• Risk: 70 pts
• Reward: 322 pts
• Risk-Reward Ratio: 4.6R
Scenario 2: Pullback to Support, Range-Bound Consolidation
If the market pulls back, we expect the yearly VPOC and AVWAP from May 11 to act as key support levels. In this case, price action may remain range-bound within the previous week’s range, forming an inside week.
Example Trade Idea 2
• Entry: 21,672
• Stop: 21,600
• Target: 22,000
• Risk: 72 pts
• Reward: 328 pts
• Risk-Reward Ratio: 4.6R
________________________________________
Glossary
• VPOC: Volume Point of Control
• VA: Value Area
• VAL: Value Area Low
• VAH: Value Area High
• VP: Volume Profile
• AVP: Anchored Volume Profile
• Y: Yearly
• pWk: Previous Week

push up nasdaqwe can see that the market has properly push to the upside, looking for a break of range.
entry is in blue, and correspoinds to daily levels that has shown rejection to the upside.
possible drop in the first minutes, and then a move to the upside.
entry in blue. stop in red and target in green.
HAVE FUN
TSP

6.16.25 Weekly LevelsES Expected Range: 5993.16 - 6169.64
ES Skew: +.86% 6123.19
NQ Expected Range: 21,692.92 - 22,463.12
NQ Skew: +1.06% 22,258.40
Po3I See a Perfect Accumlation, Manipulation,Distribution On The MNQ Chart After The Sweep of a LOW at 21,471...... LET SEE ON NY OPEN..

NQ Power Range Report with FIB Ext - 6/16/2025 SessionCME_MINI:NQU2025
- PR High: 21903.75
- PR Low: 21726.00
- NZ Spread: 396.75
No key scheduled economic events
Contract rollover week
Session Open Stats (As of 12:15 AM 6/16)
- Session Open ATR: 382.14
- Volume: 18K
- Open Int: 62K
- Trend Grade: Neutral
- From BA ATH: -4.1% (Rounded)
Key Levels (Rounded - Think of these as ranges)
- Long: 22096
- Mid: 20383
- Short: 19246
Keep in mind this is not speculation or a prediction. Only a report of the Power Range with Fib extensions for target hunting. Do your DD! You determine your risk tolerance. You are fully capable of making your own decisions.
BA: Back Adjusted
BuZ/BeZ: Bull Zone / Bear Zone
NZ: Neutral Zone

NQ dip expectation for no apparent reason (almost certainly not NQ has a good 35 minute window to make the ultimate fall sub 21400

NQ Analysis for the past weekNasdaq has been volatile in the last week and the price didnt decisively break the ATH and tested it. Further with the evolving geo political scenario lets see what happen in the coming week.

NQ trades with 350+ ticks in profit for longCaught a solid long setup on NQ during the Asia open session, following clean price action and key demand zone confirmation. Two take-profits were hit, and one position closed at break-even — locking in 350+ ticks overall.
Patience and precision paid off today. Zones marked in advance using my custom supply/demand indicator.
#NQ #NasdaqFutures #FuturesTrading #SupplyAndDemand #DayTrading #MicroFutures #PriceAction #TradingViewIdeas #AsiaSession

#202524 - priceactiontds - weekly update - nasdaq e-mini futuresGood Day and I hope you are well.
comment: I do think we will continue to print lower highs from 22094. Very clear invalidation price for that thesis is a print above 21855. 21000 is my target for the next days/weeks. A strong daily bear close below the daily 20ema around 21450 would be my confirmation. Above 21855 we continue to chop sideways and could retest 22094.
current market cycle: trading range most likely for now until we have a daily close below 20ema
key levels for next week: 21450 - 21855 (below 21450 - next target is 21000 and above 21855 next target is 22000)
bull case: Bulls outdid themselves by almost completely reversing the strong sell-off on Friday. That certainly was unexpected but now is decision time. Can they keep the market above 21500 a second time? If so, most bears will likely be quick to give up again and we can continue sideways 21500 - 22100 or even higher. Since we did not close below the daily ema, bulls remain in control.
Invalidation is below 21450
bear case: Bears see the bull wedge as broken and want to trade down from here. The top we have formed is a credible double top with ath 22656 and good for swing shorts. Bulls have been given two amazing macro numbers last week, especially the cpi print and we could not break strongly above. Instead we got a spike and it crumbled afterwards. Those are the type of things that don’t happen in bull trends.
Invalidation is above 21855
short term: Neutral for now and I wait for the breakout to either side. I want to favor the bears but they were so weak after the Globex sell spike on Friday, it’s not wise to hope they suddenly become strong.
medium-long term - Update from 2024-06-15: Daily close below 21450 is my validation for the new bear trend which has the first bigger target at 21000 but I think we will printed below 20000 again this year. Structure is obviously not yet bearish, so don’t be early if you want confirmation and can’t/won’t scale in to shorts higher.

NASDAQ (NQ) ANALYSIS FOR THE WEEKI've been studying NQ & others and want to share my analysis. Trading involves probabilities, so it's essential to be confident and prepared. Study the market thoroughly before trading with real money.
Let's test strategies this week. You may use a live account if you have capital, and manage your stop losses carefully. Next week, I'll provide more details on entry points and stop losses. Wait for trades at specified levels and avoid positions in the middle to minimize losses. Be patient and trade from one edge to the other.
Good luck and make money.
For one-on-one sessions: $20k per person. You'll learn weekly, monthly, and yearly calculations. Weekly subscriptions are also available for $500 per person.
Disclaimer:
The forecasts provided herein are intended for informational purposes only and should not be construed as guarantees of future performance. This is an example only to enhance a consumer's understanding of the strategy being described above and is not to be taken as Blueberry Markets provides personal advice.

For tomorrow’s Asia open (6 PM EST):NASDAQ Futures Setup – Asia Open Outlook (6 PM EST)
Watching price action closely around zone #24. If we reject this level, I’m anticipating a potential short setup targeting zones #25 and #26, with a final support area near #27. Will reassess if price breaks above and holds #24.
Stay nimble — volatility around session opens can offer great opportunities.
#NASDAQ #MNQ #Futures #AsiaOpen #PriceAction #DayTrading #S&P500 #MicroFutures

NASDAQ Daily Observation Scenarios & Probabilities In ContextCME_MINI:NQ1! CME_MINI:MNQ1! IG:NASDAQ BLACKBULL:NAS100 EIGHTCAP:NDQ100
Well obviously they're 3 possible outcomes but the idea is how we read the context in the upcoming week as the market unfolds each day. But, weighing the outcome based on the current news / fundamentals I would be leading towards 2/3 the the Bullish Long-Term Trend still holds true.
My assumptions would be holding on to the news development of the Iran Israel conflict.
Based on TA heavy we would be still be bullish but a good retracement as the Negotiations of ceasefire with market volatility increase as each time there's a news update with the Conflict & top that with the current Trump Tweets, Tariffs, FED Rate cuts.
Market is weighing the value of this Conflict escalation and deciding the time to price it in. Because market is always forward thinking, IMO.
I personally will be trading these scenarios each-day as the market updates me with NEWS, TA and mainly the Key Levels. As a day futures trader, I will be preparing for volatility. Not as much as the "Liberation Day Sell Off" or the "90 Day Tariff Extension Rally", but futures traders thrive in these kind of market conditions.
It is also sad to hear about the news, or course fundamentally. I am also hoping for the market to make a strong stance absorbing it all with a positive outlook.
Bullish Scenario:
- Market ignores all the war in the Middle East and a rally continuation to make New All Time High.
- News updates on the development of de-escalation war negotiations each day which ends up with a Weekly positive green candle.
Neutral/Consolidation
- News updates brings about both positive & negative impact causing market to range giving the opportunity for accumulation / distribution.
Bearish
- Bad news WAR escalation, Tariffs, Not enough Rate Cuts, Bearish Data.
- Sell side Liquidity wipeout
NOTE:
* 2/3 outcome leaning Bullish because even when a retracement / pullback happens we will rally back up
* since it's a daily observation, i will be looking into the Daily Key Levels of Support/Resistance, Fib Levels, Liquidity Zones, Volume Levels to be tested.
* I wish all good luck and god bless. Thank You.

NASDAQ Weekly Analysis TA & Fundamental News Alignment CME_MINI:MNQ1! IG:NASDAQ CME_MINI:NQ1! NASDAQ:NDX BLACKBULL:NAS100
Highest Probability for the upcoming week?
Not looking good with the Friday news tension of Israel Iran war escalation.
Not much of a selloff coming in, I guess the market is still in the wait and see mode of the upcoming weekend news development; could even be in the next week if the success of de-escalation negotiations.
The TA sure look eerie though, big a** H&S formation completion of the last leg. If successful, could we well be in the recession? Will this scare off the FED and force them to CUT RATES?
Smart money opportunity to buy another big dip?
Have we been in a real proper pullback after a massive rally from "Liberation Day" ?
I wonder why we can't break this level in the last week, could it be that the Smart Money selling to Retail?
It sure does look like an exhaustion point doesn't it?
BEARISH SCENARIO:
- Final Leg of the H&S lead to a massive selloff by Retail and Smart Money buying the dip.
- News WAR breakout with Iran vs Israel, with every development leading to a sell-off / rollover.
- Weekend news leading to a massive gap lower in the Monday Asia Open.
- Last week weekly candle close RED wick/shadow suggesting a strong resistance/ rejection level. A high-probability of the next candle will also be a RED Weekly Continuation?
BULLISH SCENARIO:
- Healthy Retracement and holding strong support levels.
- Even for any bearish news the market holds & the participant buying power will maintain a healthy pullback.
- Sweep up to the liquidity making New All Time High.
NOTE:
*This is a weekly analysis, Price Action within the week will reflect differently from day to day.
*The outcome will only be projected by the end of next week.
*Please do comment on your thoughts, a healthy discussion is always welcomed.
*I am publishing my thoughts and context to the way I interpret the market, in no way I am giving any financial advise.

NQ100 → Entering the Danger Zone?📈 1. Technical Context (Price Action & Structure)
The daily chart shows a strong bullish continuation from the 17,350 area, with price now extending toward the 22,000 USD zone.
We are currently within a weekly/monthly supply, with:
Mild RSI divergence in overbought conditions
Temporary rejection at 22,050–22,200
A potential liquidity sweep above highs before distribution or pullback
The monthly structure shows a strong swing low that may serve as anchor for a future reversal
🧠 2. COT Report – Commitment of Traders (as of June 3)
Commercials (Smart Money):
+4,041 long | +3,320 short → Net +1,455 → hedging phase, not trend expansion
Non-Commercials (Speculators):
–2,237 long | +125 short → net exposure reduction
Open Interest increasing → new positions building, but no extreme imbalance
📌 Conclusion: Tactical neutrality, slight bullish lean from commercials.
📆 3. Seasonality
June has been historically bullish, especially in the past 2 years (+700 pts avg)
10Y average still leans bullish
⚠️ September is a clear seasonal reversal month across all timeframes
📌 Conclusion: Seasonal tailwind through end of June; cyclic reversal risk into Q3.
📰 4. Macro Calendar
High-impact USD week:
CPI – Wed, June 11
PPI – Thu, June 12
These will be critical to:
Validate the disinflation narrative
Set expectations for a Fed cut by Sep/Nov
📌 Conclusion: Expect explosive mid-week volatility — watch for liquidity spikes above 22,000 if CPI surprises.
⚙️ Operational Outlook
✅ Primary scenario (bullish continuation):
🎯 Target: 22,260 → fib extension + structure
❌ Invalid below 21,350
🔄 Alternative scenario (mean reversion):
🔻 Short from 22,050–22,200
🎯 Target: 20,950 → liquidity + FVG zone
🔁 Trigger: weekly engulf or hotter-than-expected CPI
