Nasdaq (NQ) Set to Complete 5 Waves, Defining Bullish TrendOn April 7, 2025, the Nasdaq (NQ), like other major global indices, marked a significant low, setting the stage for a potential bullish trend. From this low, the index has embarked on a five-wave impulsive rally. This a hallmark of bullish momentum in Elliott Wave theory. The initial advance, wave 1, peaked at 18,361.5. It was then followed by a corrective pullback in wave 2, which found support at 16,735. From there, the index resumed its upward trajectory in wave 3. The move up in wave 3 has an internal five-wave structure, signaling strong bullish momentum.
Within wave 3, the first sub-wave, ((i)), concluded at 19,386.75. Subsequent pullback in wave ((ii)) found support at 17,700. The index then surged higher in wave ((iii)), reaching 21,562. Afterwards, a corrective dip in wave ((iv)) ended at 20,725.04, as illustrated on the one-hour chart. This wave ((iv)) correction unfolded as a double-three Elliott Wave pattern. Wave (w) bottomed at 21,072.75 and wave (x) peaked at 21,337.5. The final leg, wave (y), concluded at 20,725.04, completing the correction.
The Nasdaq has since turned higher in wave ((v)). From the wave ((iv)) low, wave (i) advanced to 21,858.75, followed by a pullback in wave (ii) to 21,071.5. The index is now poised to extend higher in wave (iii) of ((v)), continuing the impulsive rally from the April 7 low. In the near term, as long as the pivotal low at 20,725.04 holds, any pullbacks are expected to find support in a 3, 7, or 11-swing pattern, paving the way for further upside. This technical setup suggests the Nasdaq is well-positioned to sustain its bullish momentum in the coming sessions, provided key support levels remain intact.
UNF1! trade ideas
2025-06-03 - priceactiontds - daily update - nasdaqGood Evening and I hope you are well.
comment: Bulls buy every dip and so should you, until it stops working. Clear target above and also clear invalidation level below us. Trade the wedge.
current market cycle: trading range
key levels: 20700 - 22000
bull case: Bulls will likely get a third leg up tomorrow and if they want it bad, we could accelerate upwards for 22000. Right now the wedge is clear but if we get so close to 22000, I doubt market will hesitate to print it. Bulls have to stay above 21500 or risk a deeper pullback to 21300 and I don’t know if they could do 22000 afterwards. If we print below 21500, I think I’d expect a lower high below 21800 but for now they are in full control and are favored for 22000.
Invalidation is below 21500.
bear case: Literally the exact same play every day. Globex and EU sell it, US session pumps. Don’t fight it. Will end soon but just don’t be early. Below 21500 would be a start but only a daily close below 21000 will make me turn bear.
Invalidation is above 22100.
short term: Neutral because longs above 21650 are bad. Wait for a pullback to 21600 or 21550. Can you make them work? Sure but you would have to have a stop at least 21400 and scale in. Bears have nothing for now.
medium-long term - Update from 2024-05-24: Will update this section more after the coming week but in general the thesis is as for dax. Down over the summer and sideways to up into year end. I don’t think the lows for this year are in.
trade of the day: Longing the double bottom on the 15m tf on US open at 24500.


NQ: 201st trading session - recapThe 200ds start out really boring. As stated on the chart: It is just the majority of all session, I'm hoping we either break out of this weird consolidation cycle or we see some real action at sum POI's

Nasdaq 100 Uptrend Approaching Important Resistance LevelHey Traders so today still looking at Nasdaq 100 now in strong uptrend but watch close this 21,867 level because a few things could happen. It could break through which would be bullish. It could pause and consolidate or it could reverse.
Then we have the All Time High at 22,684 not too far away!
So if your bullish wait for a closing price above that level 21,867 before continuing to buy or better yet let it break above them pullback then buy at a better price.
However if you bearish I wouldn't try shorting until a break below support at 20,700
Always use Risk Management!
(Just in case your wrong in your analysis most experts recommend never to risk more than 2% of your account equity on any given trade.)
Hope This Helps Your Trading 😃
Clifford

First Tradeify Funded day. $232 profit came with patienceI go over how I made the most of an overall choppy day and came out green. I love the game of trading and all its done for my life. Still unprofitable but after just being over a year in I am so proud of how I executed today.

June 2nd Analysis - NasdaqA Live trading plan on nasdaq
Weekly: bearish
Daily: bearish
Trade direction: Short

550+ Points Secured on MNQ | Bullish FVG + Gap Fill PrecisionIn today’s trade, we captured over 550 points on MNQ, banking a solid $288 profit on one clean, high-probability setup.
Here’s the breakdown:
Sunday’s open left a gap above, creating a clear target for buy-side liquidity.
During Asia, price dipped into a validated Daily Bullish FVG, which had previously been traded through and reclaimed — a powerful sign of support.
As price retraced into the 30m FVG and approached its high, I entered at 7AM, aiming for the equal highs above.
Although we exited slightly early before the 10am open push, price ultimately fulfilled the full TP target, confirming the strength of the setup.
🎯 Bonus insight: As mentioned in the video, re-entry at the 50% of the 30m FVG was also valid — and it could’ve netted another 600+ points. That’s how powerful these FVG structures are when aligned with narrative and timing.
Watch the full video to see the exact entry logic, TP strategy, and lessons learned.
Don’t forget to like, comment, and subscribe for more trade recaps and educational content!
#MNQ #NasdaqFutures #FVG #FairValueGap #LiquidityTrading #DayTradingStrategy #SmartMoneyConcepts #TradeRecap #FuturesMarket #GapFill #PriceAction

NQ: 200th trading session - recapDamn, we're not only in the triple digits but also in the 200dreds. Gotta be proud of my journey. If I look back to my first session (which was last year) you can see the immense progress I've made. Heck, even look at the 100th or 150th. So much progress in just such a short amount of time. Where will I be on my 300th?

NQ - Are we going to take another dip?Welcome to Fundfinity Network – the premier community for funded traders focused exclusively on futures trading.
Gain your edge with powerful trading signals, in-depth market analysis, and a network built to support your journey to consistent success in the funded trading space.
Join us and elevate your strategy, discipline, and profitability.
If we can stay below this resistance we’ll continue to look for lower.

Nasdaq Bullish Speed is expected.Nasdaq (and indexes) are expected to rally with speed after FED release and perform towards the target 22,250.00.
We're going to allow for potential wicks lower on FED release though.

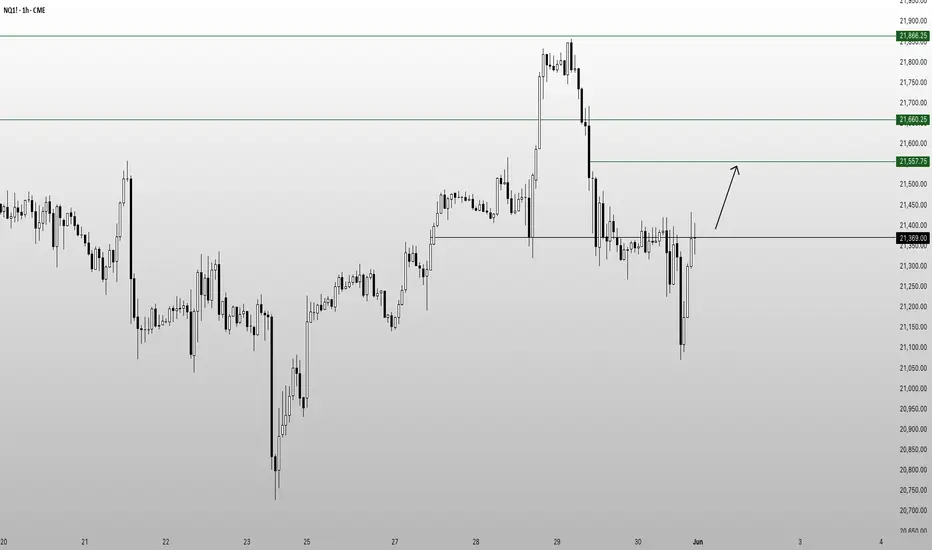
NQ's next targetCME_MINI:NQ1! looks to be in a 50/50 probability...maybe
I am only expecting price to reach $21557
This is the clearest target so far. This is subject to Sundays open also.
But looking for price to reach this level and then we will get a better understanding on the next draw.
NQ1! Gap DownEntry missed by 5 ticks or 1 point and 1 tick. Unfortunately, the idea behind this setup can't be shown to the detail that I would have liked, on a chart, as I am unable to publish an idea on timeframes of less than M15. However, I will try my best to describe and explain as clearly as possible in this idea.
My first thought of call after hearing the new Steel Tariff news was that Futures would possibly gap down into Sunday's open. This part of the thesis was correct and so continuing from here, I wanted to see how price action behaved post the gap down and whether or not price would fill the gap or rolled over and begin a further leg down. To the aid of 20/20 hindsight, we can now see that price rolled over to the downside. This next part is significant to whether I was going to leave a Limit Order resting. Before the roll-over was instigated, I would have presumed that traders who were immediately short from the open were then in immediate drawdown due to the temporary rise in prices before the continued down-move. Their buy-stops would have either been above the first one minute candle's high, at an area below the previous support now turned resistance or above Friday's close.
Again hindsight shows now that the majority of the short term liquidity was at a zone below the previous support area. After the initial roll-over move, I then immediately changed to an M1 timeframe to see if I could spot firstly a liquidity grab and a break of structure to the downside due to displacement thus creating a bearish price imbalance or more commonly known as a Fair Value Gap. The presumption that whoever placed market orders immediately at the open, boosted this theory that Buy-Side-Liquidity could be present above the market price.
On M1, I spotted the roll-over to the downside after taking out all the traders that were immediately short from the open. Then, in conjunction with one another a break of structure and displacement. Displacement, a strong period of selling pressure producing a price imbalance or Fair Value Gap in this instance needed to cause price action to close below or break the short-term swing low after the liquidity grab, which is known as either a market structure shift or break of structure.
There were two opportunities to trade short before leaving my Limit Order resting at the Fair Value Gap that you will be able to see on the chart as a small red rectangular box. All the necessary labelling is there. I was just not on my toes enough to spot the first two OTE points before seeing the market drop further. Therefore, I thought to myself, leave one sell contract resting at the 0.25 Gann level, being measured from the high of the lower wick of the FVG to the low of the higher wick of the FVG, (this is something that I am back-testing to see if the 0.25 Gann level always gets hit within these price imbalances or not) with a stop above the first bearish candle's high that caused the break of structure on M1.
I hope this description is good enough for anyone wanting to read this. If you have the ability to scale down to the M1 chart then please do take a look at the NQ1! from last night's open and I wish you all good trading.

The Last Batch of Good DataCME: Micro E-Mini Nasdaq 100 Index Futures ($MNQ) #TheFuturesLeap #Microfutures
Investors have defied the Wall Street adage of “Sell in May and Go Away”.
The S&P 500 rose by 6.2% in May while the Nasdaq climbed 9.6%. Both indices notched their best monthly results since 2023. The Dow Jones gained 3.9% for the month. The S&P stood out as it recorded its best performance for the month of May since 1990.
Several favorable factors propelled May’s impressive stock index gains:
• Early-May employment data pointed to continued strength, raising risk appetite.
• A temporary U.S.-China tariff reduction for 90 days helped calm trade tensions.
• Robust earnings from Nvidia and Super Micro Computer fueled rally momentum.
Meanwhile, these unfavorable events also occurred in May:
• Moody’s downgraded the US sovereignty rating. By now, the US has lost its AAA ratings from all three major credit agencies.
• The 20-year Treasury bond auction received a cold shoulder in the bond market.
• The trade talk between U.S. and China has been stalled apparently.
In any other time, bad news of such significance would send the stock market into a free fall. But investors turned a blind eye to them. This highlighted a bullish market sentiment, a prevailing appetite for risky assets amid uncertainty in geopolitical and trade tensions.
Underpinning the rising stock prices are solid macroeconomic data for the month of April and strong Q1 earnings from major US corporations. Given that stock prices reflect expected future earnings, it is fair to ask: Will the data stay good?
Import dependency is unlikely to change any time soon
On May 30th, US Census Bureau reported that the U.S. trade deficit in goods narrowed sharply in April, with the gap contracted 46.0% to $87.6 billion. Goods imports decreased by $68.4 billion to $276.1 billion. Exports of goods increased by $6.3 billion to $188.5 billion.
What really happened is that there was a boost in imports in Q1 due to the front-running ahead of tariffs. This ended in April as the higher rates kicked in. If we take March out as an outliner, we will find that the April data is 9.7% higher than February. As a matter of fact, U.S. trade deficits in 2025 rose sharply comparing to 2023 and 2024 levels.
With the US-China interim trade deal in effect from May 14th, we could expect large waves of imports to resume from now through August, pushing trade deficits even higher.
The global supply chain is decades in the making. Its undoing will take years. Meanwhile, imports will pour in, only at higher costs due to the new tariffs and higher freight costs.
My conclusion: U.S. trade deficit will grow bigger, at least for the remainder of 2025.
Retail price hikes could cause inflation to rebound
US retailers largely source their products overseas. Could they just “eat the tariffs?”
• Walmart: FY2024 revenues $681 billion (+5.1% YoY). Net income jumped 25.3% to $19.4 billion, lifting its net profit margin to 2.9%.
• Target: Revenue $107.4b (-1.6%). Net income $4.14b (+49%). Profit margin 3.9%.
• Costco: Revenue $254.5b (+5.0%). Net income $7.37b (+17%). Profit margin 2.9%.
• Walgreens: Revenue $147.66 billion (+6.17%). Net Income -$8.64 billion (-5.9%)
• Amazon: Revenue $638.0b (+11%). Net income $59.2b (+95%). Profit margin 9.3%.
Apparently, even the largest and the most efficiently run retail giants are operating with a razor-thin margin. Retailers really have no choice but to pass on the tariffs to consumers, in the form of higher prices.
On May 15th, Walmart announced to raise prices starting in late April. The price hikes would accelerate in May, and a larger sting will start to be felt in June and July when the back-to-school shopping season goes into high gear.
Other retailers are expected to follow suit. Walmart’s action provides air cover for the tens of thousands of retailers to raise their prices freely.
My conclusion: Inflation will go up from May through the holiday season in December.
Higher interest cost will eat into the bottom line
While stock investors brushed off the Moody’s downgrade, the bond market has been in real trouble. As the US treasury bonds lost their “risk-free” status, debts of all kinds and all durations see a big spike in yield. Bond investors are undergoing a complete makeover of repricing bonds and reassigning a new “risk premium”.
On May 21st, the U.S. Treasury held an auction for 20-year bonds that fell significantly short of expectations. The lack of bidders—an alarming indicator of waning confidence in the U.S. economy—resulted in the yield on these bonds skyrocketing to 5.1%.
The bond yields go up even though the Fed holds rates steady. This indicates that central bank monetary policies are not very effective in shaping the long end of the bond market. Even if the Fed lowers the overnight Fed Funds rates, bond investors would still demand higher yield to compensate for the perceived risk increases for the once “risk-free” instruments. Commercial banks could keep interest rates high for mortgages, corporate bonds, auto loans and credit cards.
As of June 2nd, the futures market puts the odds of the Fed holding rates unchanged at 95.4% for its June 18th FOMC meeting, according to CME Group FedWatch tool.
www.cmegroup.com
My conclusion: The Fed may have little appetite for cutting rates if inflation goes up. When they cut the overnight rates, businesses and households may not get any relief from high interest expenses.
Trade tensions and geopolitical risks may stay elevated
Before the ink dries on a temporary agreement, the trade talk between U.S. and China has been stalled. The minister-level negotiation has gone nowhere, and it may take presidential talk to salvage the agreement. At this point, we could not make any assumption about any trade agreement. Its shape and form and timing are uncertain. If the trade talk breaks down, we will see a new round of tariff reescalation and retaliation.
On June 2nd, breaking news report that Ukraine carried out a large drone attack deep into the Russian territory. Russian retaliation is expected. After months of effort, potential ceasefire and peace negotiation could fall apart.
My conclusion: Trade and geopolitical tensions are both escalating, after early signs of calming down. These would hurt economic growth and dent investor appetite for risk.
Trading with Micro E-Mini Nasdaq 100 Index Futures
Based on my analysis above, I hold the opinion that good data may quickly turn bad in the coming weeks, and correction in the US stock market is imminent. Valuation at the current lofty level completely ignores the risk escalation closer on to us. Anyone sharing this view could express it by shorting the CME Micro E-Mini Nasdaq 100 Index Futures.
The Micro Nasdaq contract has a notional value of $2 times the index. At the Friday closing price of 21,578, each September contract is worth $43,156. The minimum margin for shorting one contract is $3,036 at the time of this writing.
The latest CFTC Commitments of Traders report shows that, as of May 27th, the total open interest for Emini Nasdaq and Micro Nasdaq futures are 275,143 and 204,499 contracts, respectively.
• Leverage Fund has 77,467 in long, 251,452 in short, and 10,472 in spreading
• The long-short ratio of 1-to-3.2 (= 77467/251452) show that the “Smart Money” is very bearish on the Nasdaq while the index gained nearly 10% in May
Hypothetically, if Nasdaq 100 were to pull back 5% before September, a short futures position will gain $2,157.8 (= 21578 * 0.05 * 2).
The risk of shorting the Nasdaq is that the stock index continues to rally. To hedge the downside risk, the trader could set a stop-loss at his order. For example, a stop loss at 23,000 for a short order would set the maximum loss to $2,844 (= (23000-21578) x 2).
Happy Trading.
Disclaimers
*Trade ideas cited above are for illustration only, as an integral part of a case study to demonstrate the fundamental concepts in risk management under the market scenarios being discussed. They shall not be construed as investment recommendations or advice. Nor are they used to promote any specific products, or services.
CME Real-time Market Data help identify trading set-ups and express my market views. If you have futures in your trading portfolio, you can check out on CME Group data plans available that suit your trading needs www.tradingview.com

RETRACEMENT TO FAIR VALUEThe trigger points will now push price to deliver discount levels down to an area of fair value.
Trigger points :
- March & April High
- Previous Week High inside of May;
Targets :
- Weekly & Daily Lows;
Fair Value :
- Weekly FVG;

NQ Power Range Report with FIB Ext - 6/2/2025 SessionCME_MINI:NQM2025
- PR High: 21348.50
- PR Low: 21295.25
- NZ Spread: 119.25
Key scheduled economic events:
09:45 | S&P Global Manufacturing PMI
10:00 | ISM Manufacturing PMI
- ISM Manufacturing Prices
13:00 | Fed Chair Powell Speaks
Holding inside Friday's range
Session Open Stats (As of 12:15 AM 6/2)
- Session Open ATR: 440.37
- Volume: 29K
- Open Int: 267K
- Trend Grade: Neutral
- From BA ATH: -6.2% (Rounded)
Key Levels (Rounded - Think of these as ranges)
- Long: 22096
- Mid: 20383
- Short: 19246
Keep in mind this is not speculation or a prediction. Only a report of the Power Range with Fib extensions for target hunting. Do your DD! You determine your risk tolerance. You are fully capable of making your own decisions.
BA: Back Adjusted
BuZ/BeZ: Bull Zone / Bear Zone
NZ: Neutral Zone

25.06.02 nasdaq analysis📊
📌 Friday Price Action Summary
Failed to break above the black resistance box
Repeated rejection at the zone strengthened downward pressure
As long as this zone remains unbroken, bearish bias remains
📉
Price has entered the bullish candle from May 27
If that candle breaks to the downside, a drop toward the 20EMA on the daily chart (20,930p) is likely
Currently seeing low volume and range-bound movement, so trend direction needs confirmation
🔍
If the European session fails to sustain the rebound, it will likely be a temporary move
A break below 21,218p + trendline break would confirm a short setup
🎯 Targets (TP):
TP1: 21,071p (Friday’s low)
TP2: 20,930p (Daily 20EMA)
📌 Strategic Conclusion
Bias: Bearish
However, due to declining volume and range-bound action,
→ It’s better to wait for confirmation before entering
If bearish entry conditions are met, execute with confidence


MNQ at Critical Breakout Zone – Watch for 385-Day Trend Formatio
📌 Trade Idea: MNQ at Critical Breakout Zone – Watch for 385-Day Trend Formation
Before discussing near-term action, we must emphasize the importance of NQ and MNQ — these futures contracts are considered the most accurate forward indicators of the US stock market’s direction, especially for the technology sector. While ES (S&P500 futures) reflects the broader market, MNQ/NQ provides sharper insight into tech momentum.
🕒 Weekly Pattern View
On the weekly timeframe, MNQ is showing a clear bullish trend, with price structure resembling a potential bullish abandoned baby pattern — typically signaling a strong reversal from bearish to bullish.
📅 Daily Structure & Breakout Watch Zone
On the daily chart, the 21,549 – 22,135 zone is the critical breakout range.
If MNQ successfully breaks above this zone, it may trigger the start of a new 385-day bullish trend cycle.
This breakout phase may stretch up to 31 days before confirmation is fully established.
⚠️ Trading Strategy Guidance
At this stage, patience is key —
❌ Avoid rushing into short positions near the breakout zone.
✅ Favor the bullish bias, as structure and volume are still tilted toward upward continuation.
⚠️ Be cautious of false breakouts or sharp pullbacks (cat bounce) within this zone — it’s a high-risk area for both sides.
💡 Conclusion:
MNQ is currently sitting at a pivotal level. If a breakout holds, it could lead to the formation of a powerful upward trend for the next quarter. This is not the time to short blindly — instead, wait for breakout confirmation, monitor pullbacks, and apply trailing stop risk management for position entries.
Disclaimer:
This trade idea is for educational purposes only and does not constitute financial advice. Trading involves risk. Always conduct your own analysis or consult a financial advisor before making trading decisions.

Nasdaq Signals Economic Instability – Are You Watching CloselyDear traders,
You may be witnessing a “first” — a pivotal moment right before things begin to spiral.
We’re not fortune tellers. We don’t claim to predict the future.
But what you’re about to read is based entirely on publicly available data, interpreted not through speculation, but through a deep, rational analysis of interconnected facts — the kind of connections that most overlook, and few dare to question.
We may not know how the future is being orchestrated behind the scenes...
But one thing seems certain: crisis always comes first... and then we are given a narrative to justify it — be it war, a pandemic, or a "global emergency."
This is the correct sequence... and it’s the one they never teach you.
Yet for those of us who navigate the financial markets, one question matters more than all others:
How do we profit from this?
We recently shared an important setup on the Nasdaq index, the benchmark that reflects — to a large extent — the true state of the U.S. economy.
As a proxy for the 100 largest American corporations, the Nasdaq plays a critical role in signaling macro trends.
And while some are just now waking up to the storm ahead, our outlook has been clear since October 2022:
A major economic crisis was not only probable… it was inevitable.
Some analysts chalk this up to uncontrolled money printing post-2019 as governments tried to patch the damage from the COVID-19 crisis. That’s one explanation.
But at Glich, our vision is different.
More complex.
And for now… not something we can fully release.
For years, strong correlations between risk markets — especially U.S. equities and crypto — held firmly in place.
But something changed on May 30th, 2025. Completely and unmistakably.
The link was severed.
Now ask yourself:
Why was Bitcoin created in the first place?
It wasn’t just digital money.
It was a bold, revolutionary idea. A system designed for a future economy no longer shackled by inflation, central banking failures, or hidden agendas.
A fluid, transparent, and secure network for a world in desperate need of change.
The current financial model is obsolete. It’s no longer evolving — just surviving.
And it can no longer answer the challenges of what's to come.
2008 was not the collapse; it was the setup. A convenient pretext to slowly roll out something new.
And "Satoshi Nakamoto"? Well, let’s just say...
That name means more than you think.
"HIDDEN INFORMATION" 👁️
What does NEO mean when he says:
"This has all happened before… yet it’s happening for the first time"?
And what does that have to do with us?
This analysis is not just about charts or setups.
It’s a hidden message — a spotlight on a once-in-a-generation opportunity lying in plain sight.
But not everyone is trained to read between the lines.
Let us ask:
Why was Donald Trump specifically pushed into position?
Why is crypto — after being suppressed, banned and attacked worldwide — now being quietly promoted and fast-tracked in legislation during 2024 and 2025?
Something’s moving beneath the surface.
🔍 In summary:
Expect a tidal wave of global crypto legislation to pass in the coming days/weeks/months.
Crypto — particularly BTC and ETH — will become silent stores of value during the economic storm.
Expect record-breaking levels:
400
K
f
o
r
B
i
t
c
o
i
n
∗
∗
,
∗
∗
400KforBitcoin∗∗,∗∗40K for Ethereum.
Yes, this may sound like science fiction…
But keep your eyes and ears wide open. 👁️
And brace yourself for a historic collapse in U.S. equities. Possibly… something we’ve never seen before.
The show is starting.
And we won’t spoil the ending — because watching it unfold is part of the experience.
But here’s what we can say, thanks to our proprietary algorithmic system:
The U.S. economy will bleed.
And crypto will blow past expectations — fulfilling the very purpose it was built for.
🛒 Load your bags in the coming days...
Because when this train leaves the station —
It won't be stopping for anyone.

#202522 - priceactiontds - weekly update - nasdaqGood Day and I hope you are well.
comment: Not much difference to the dax or sp500, so you can skip the text and just watch the chart. Should look similar to you and you should trade it the same. If you have not read my dax update, please go read it.
current market cycle: trading range
key levels for next week: 20700 - 22000
bull case: Bulls are trapping bears into decent looking shorts just to reverse them strongly. Bulls are still hopeful af and until we have a daily close below 20700, the bull wedge is alive and can lead to higher prices. Bulls are heavily favored to continue until then. Target is obviously 22000.
Invalidation is below 20600.
bear case: Bears need a daily close below 22700 and close the giant gap down to 20200. Until then they have been making money shorting new highs but only for scalps. If we get another good move down next week, you should take big profits before they vanish again. Daily 20ema held for 6 weeks now, expect the next touch to get bought as well.
Invalidation is above 22100.
short term: Bullish that we stay above 20700 and hit 22000 next week. The buying on Friday was so strong, that we can expect higher prices. I will need strong signals though since we had bad news after hours Friday and Friday was also end of month, which can always distort the market bias somewhat.
medium-long term - Update from 2024-06-01: Market is refusing to go down but I can not see this going much more up. Maybe we hit 22000 maybe we don’t. My assumption is still that latest around end of June we begin to decline over the summer. If EU tariffs go through next week or there is no really good news before end of day Friday, expect a blood bath if they come into effect. It’s a trade embargo. No one will ship anything with 50% on top of it and markets are trading like everything is literally perfect.

NASDAQ Meltdown Incoming? The Calm Before the Crash…🚨 Get ready! The NASDAQ is about to take us on a wild plunge straight to the depths of market hell... 💥🔥
Yes, yes, I know—they’ll say it’s all "because of this" or "due to that," the usual play-acting we’ve seen a hundred times before. Just another scene in the never-ending economic theater. 🎭
But here’s the forecast for tomorrow’s news:
📉 United States Initial Jobless Claims – possibly lower than expected?
📈 United States GDP Growth Rate QoQ – higher than expected?
And then... yada yada yada. You know the rest.
What does that mean? A chain reaction in risk-on assets — stocks, indexes, crypto — all heading for a steep drop. 💣📉
If you’re still a believer, here’s your solid proof — laid out 24 hours before it happens. Don’t say we didn’t warn you.
The choice is yours:
💊 Red pill or blue pill?

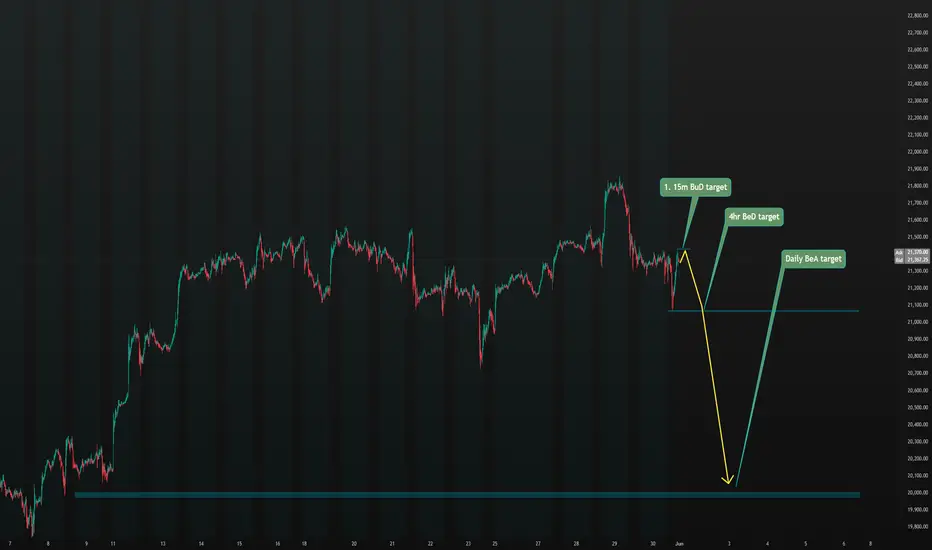
E-Mini Nasdaq 100 analysis based on Heiken-Ashi15m, 4hr, daily forecast based on Heiken-Ashi chart pattern, as I couldn't find any patterns on 1 hour chart, ones that found were already validated by this time. We'll come back to this to validate it.