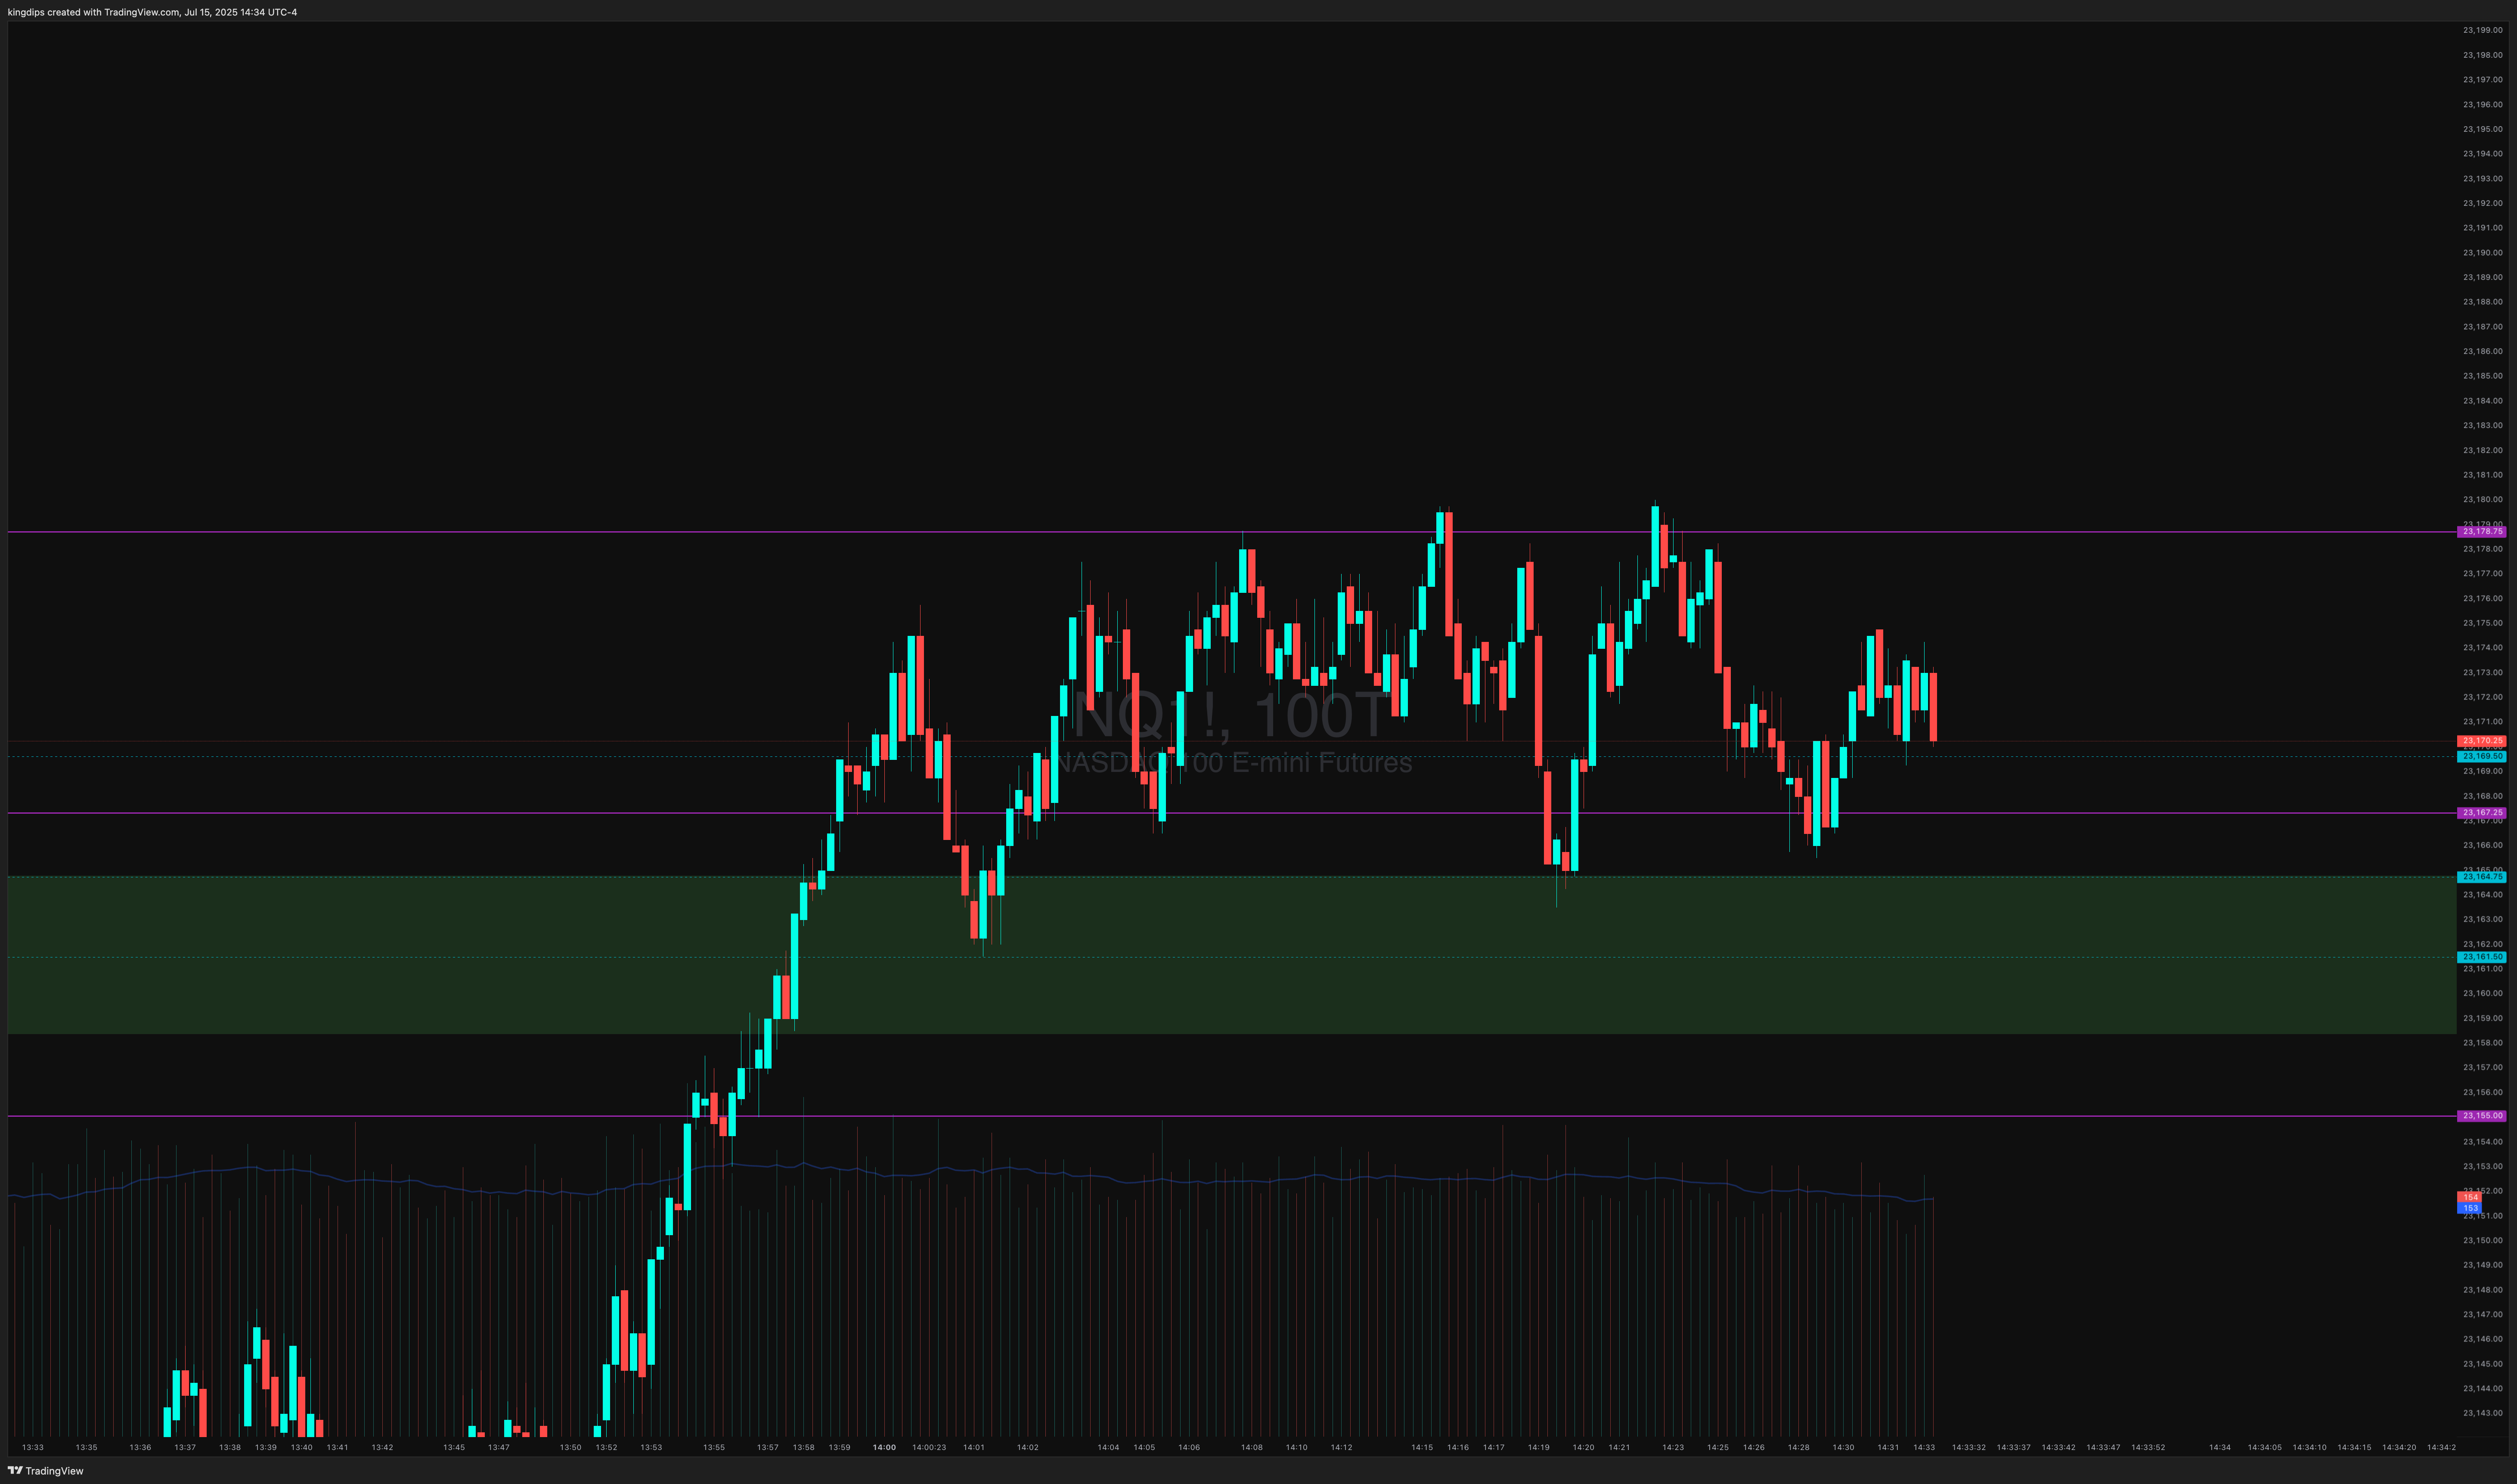
NASDAQ-100 FUTURES (Mar 2026)NASDAQ-100 FUTURES (Mar 2026)NASDAQ-100 FUTURES (Mar 2026)

NASDAQ-100 FUTURES (Mar 2026)

No trades
See on Supercharts

NASDAQ-100 FUTURES (Mar 2026) forum


NQH2025 Schumer said he wont block the budget bill tomorrow. Should be back in the mid 19500's before the Friday sell off.
Snapshot


NQ1! MNQ1!

MNQ!/NQ1! Day Trade Plan for 03/13/2025

📈19660 19760
📉19470 19380

MNQH2025 Considering taking a long position at 19,500, with a stop loss at 19,440 and take profit at 19,720. Anyone with me?

March 13, 2025: Producer Price Index (PPI) Report & Market Outlook

PPI Overview: Inflation Trends & Market Impact
The Producer Price Index (PPI) measures the average change over time in the selling prices received by domestic producers for their output. It's a key indicator of inflation at the wholesale level, influencing consumer prices, monetary policy decisions, and financial markets.

Recent PPI Trends:

January 2025: PPI for final demand increased 0.4% MoM, following a 0.5% rise in December 2024. Year-over-year, PPI advanced 3.5% in January.

February 2025 Forecast: Analysts anticipate a 0.3% MoM increase, suggesting continued inflationary pressures.

PPI Data Breakdown: Expected vs. Actual (To Be Updated Post-Release)

Expected PPI (MoM): +0.3%

Expected PPI (YoY): +3.5%

Core PPI (Ex-Food & Energy, MoM): +0.2%

Core PPI (Ex-Food & Energy, YoY): +3.2%

Actual PPI Data: Pending release at 8:30 AM EST

Immediate Market Reaction (Post-Release Update Needed)

Stocks: S&P 500, Nasdaq, and Dow futures reaction.

Bonds: 10-Year Treasury yield movement.

Forex: USD reaction vs. EUR, JPY, and GBP.

Commodities: Gold, oil, and industrial metals response.

Sector-Specific Impacts

Growth Stocks (Tech & Discretionary): Higher PPI could trigger a sell-off if rate hike fears rise.

Defensive Stocks (Utilities & Consumer Staples): Likely to outperform in a high-inflation scenario.

Industrial & Energy Sectors: Higher input costs could pressure margins.

Financials: Banks may benefit if inflation keeps rates higher for longer.

Trading Strategies & Key Levels

S&P 500 Levels: Watching 4,800 support, 5,000 resistance.

Nasdaq: Tech stocks volatile above/below 16,000.

DXY (Dollar Index): Bullish above 105 if inflation exceeds expectations.

Gold: Strong resistance at $2,100; potential breakout if inflation data disappoints.

Bonds: 10-Year yield key level at 4.25%.

Macro & Fed Policy Implications

Hotter PPI (+0.4% or higher): Could delay Fed rate cuts, leading to risk-off sentiment.

Cooler PPI (+0.2% or lower): Could reinforce rate cut expectations, boosting risk assets.

Fed Watch: Next FOMC decision hinges on both PPI and CPI trends; traders should monitor Fed speakers post-release.

Considerations for Investors

Monitor Federal Reserve Signals: Any shift in rate-cut expectations will heavily impact market direction.

Sector Analysis: Industries with high input costs may experience increased volatility.

Inflationary Pressures: Rising PPI suggests consumer prices could also increase, influencing Fed decisions.

Conclusion
The March 13 PPI report will set the tone for upcoming Fed policy moves, market sentiment and trading strategies leading into Q2. Stay alert for real-time updates post-release as market conditions evolve.

NQ1! Nasdaq showing signs of life! After a steep decline, we're seeing a potential rebound—will it hold or is this just a dead cat bounce? 👀🚀 #NASDAQ #MarketRebound #Trading

NQ1! NAS100
does anyone know why it turned on point A and not on my entry point by any chance?
i'm swapping my trend and tp system with your entry system, because i'm tired of searching
Snapshot