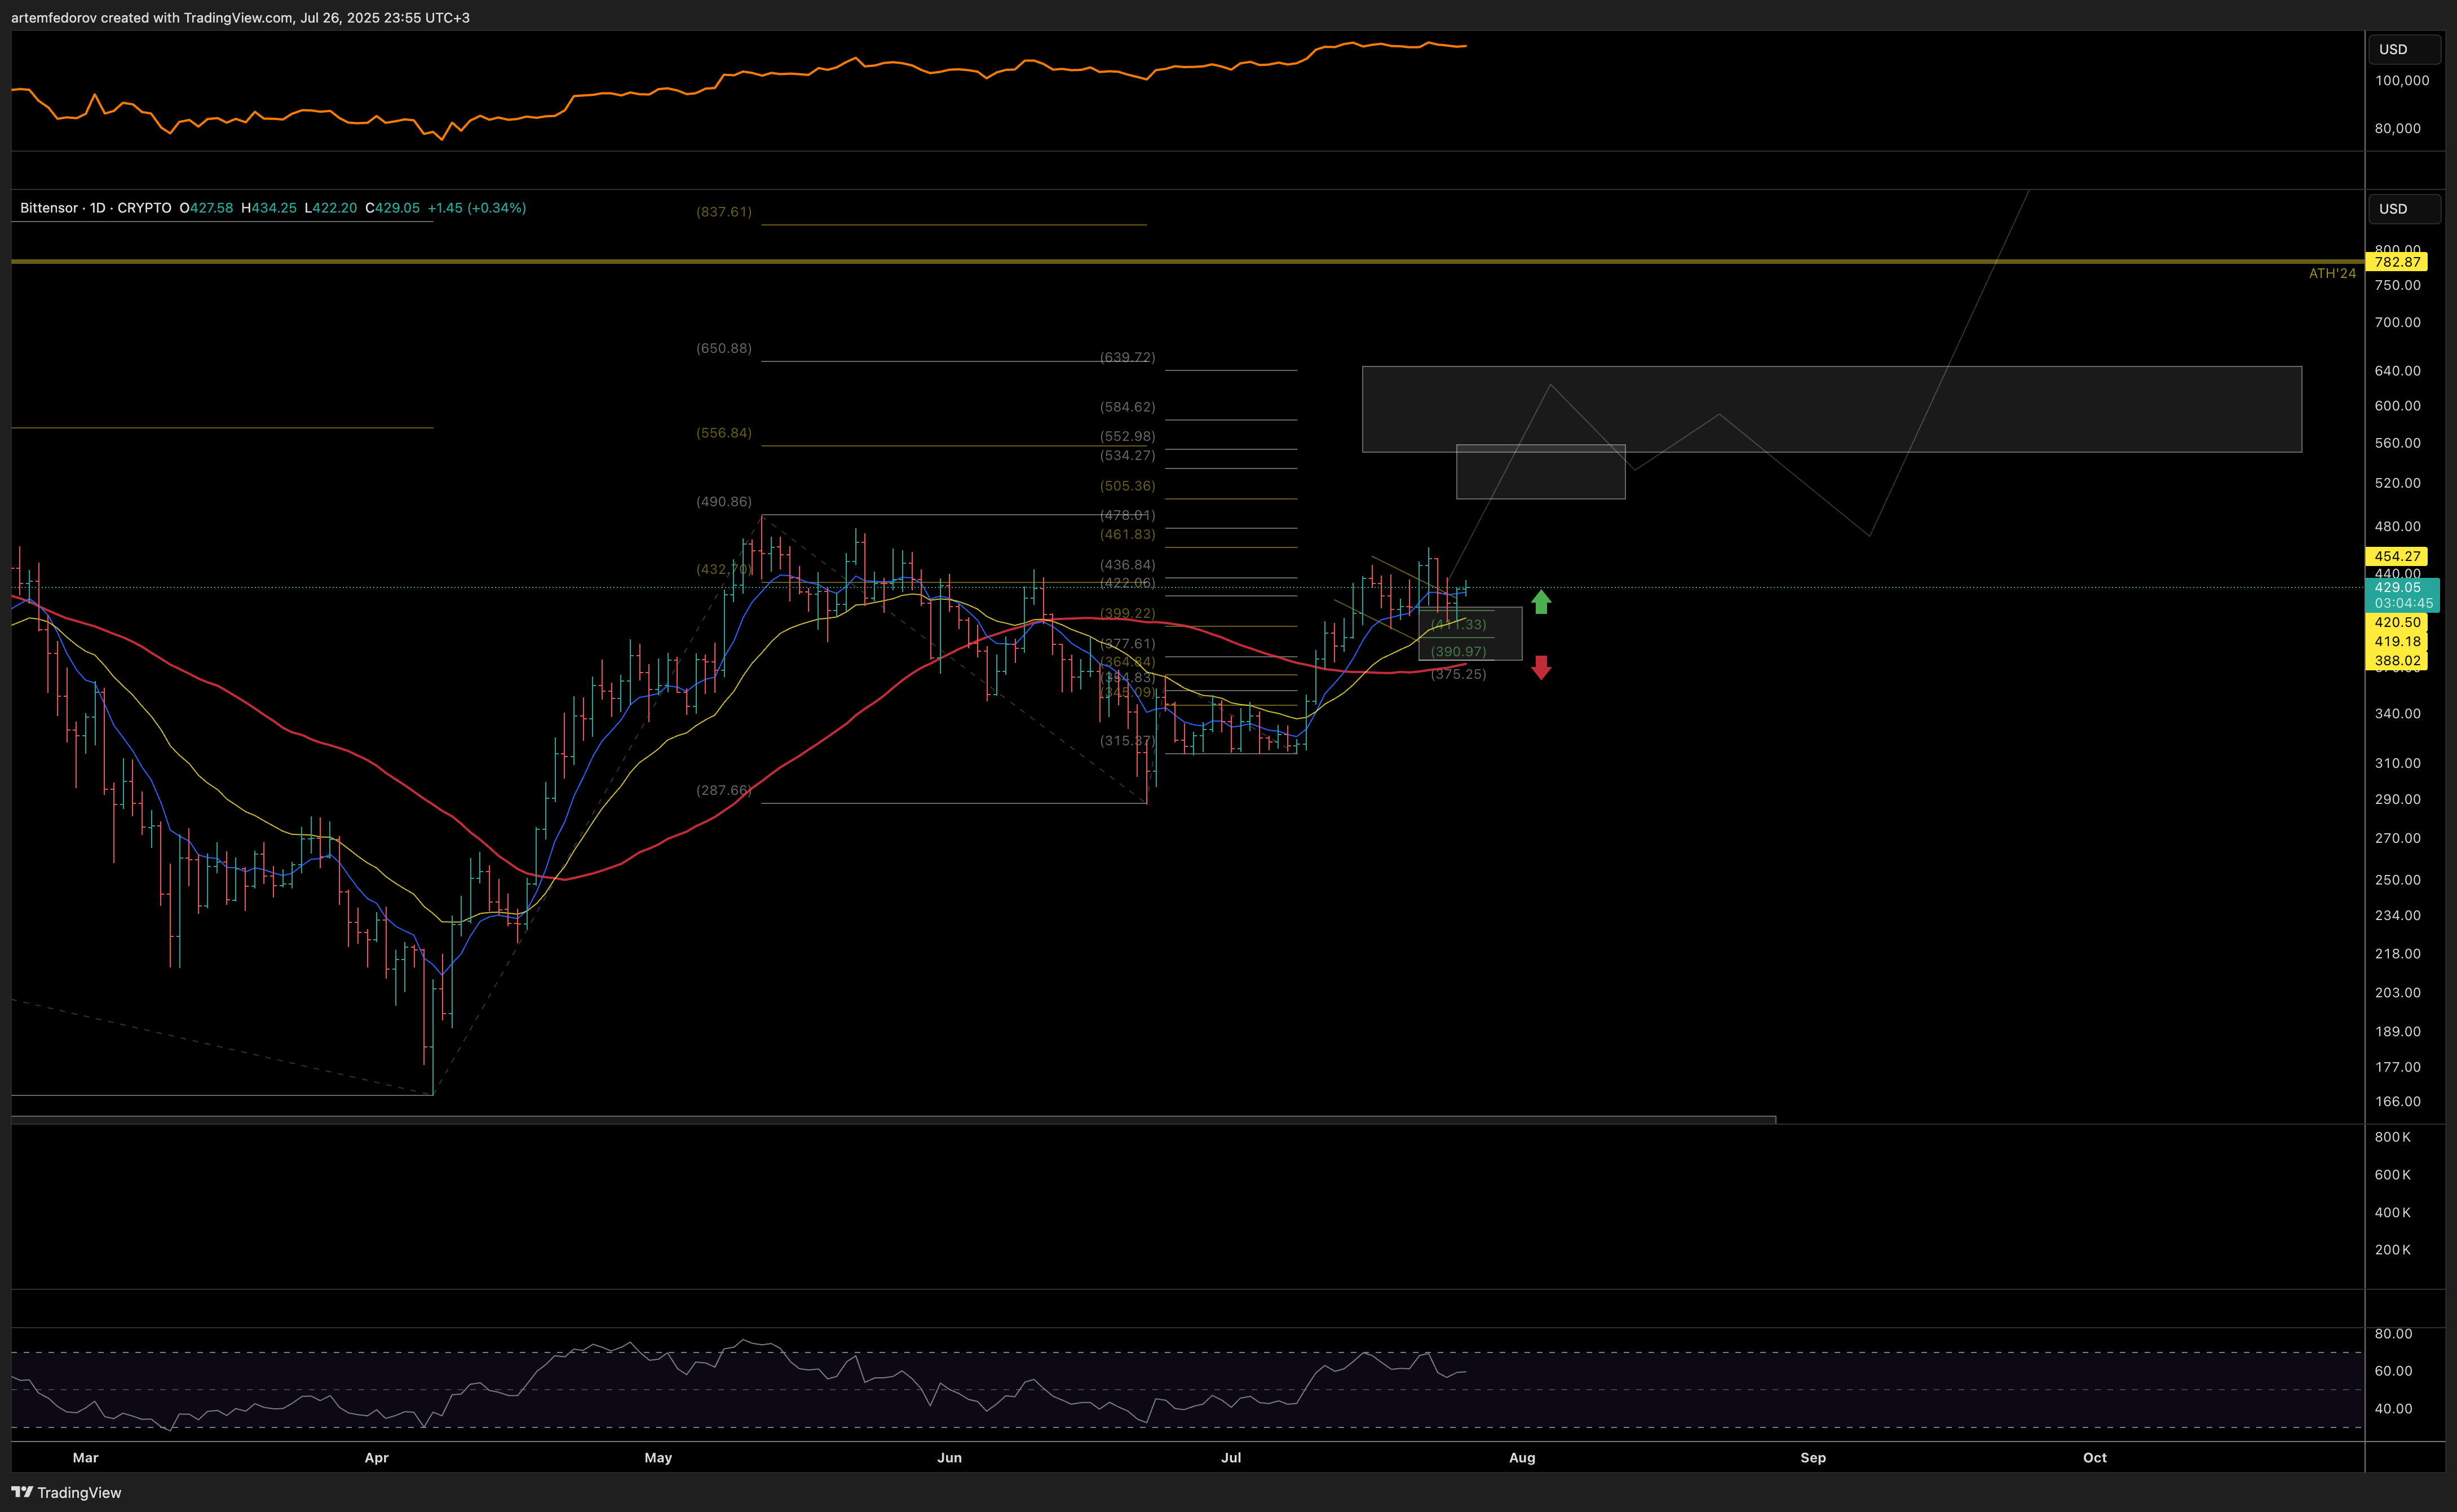
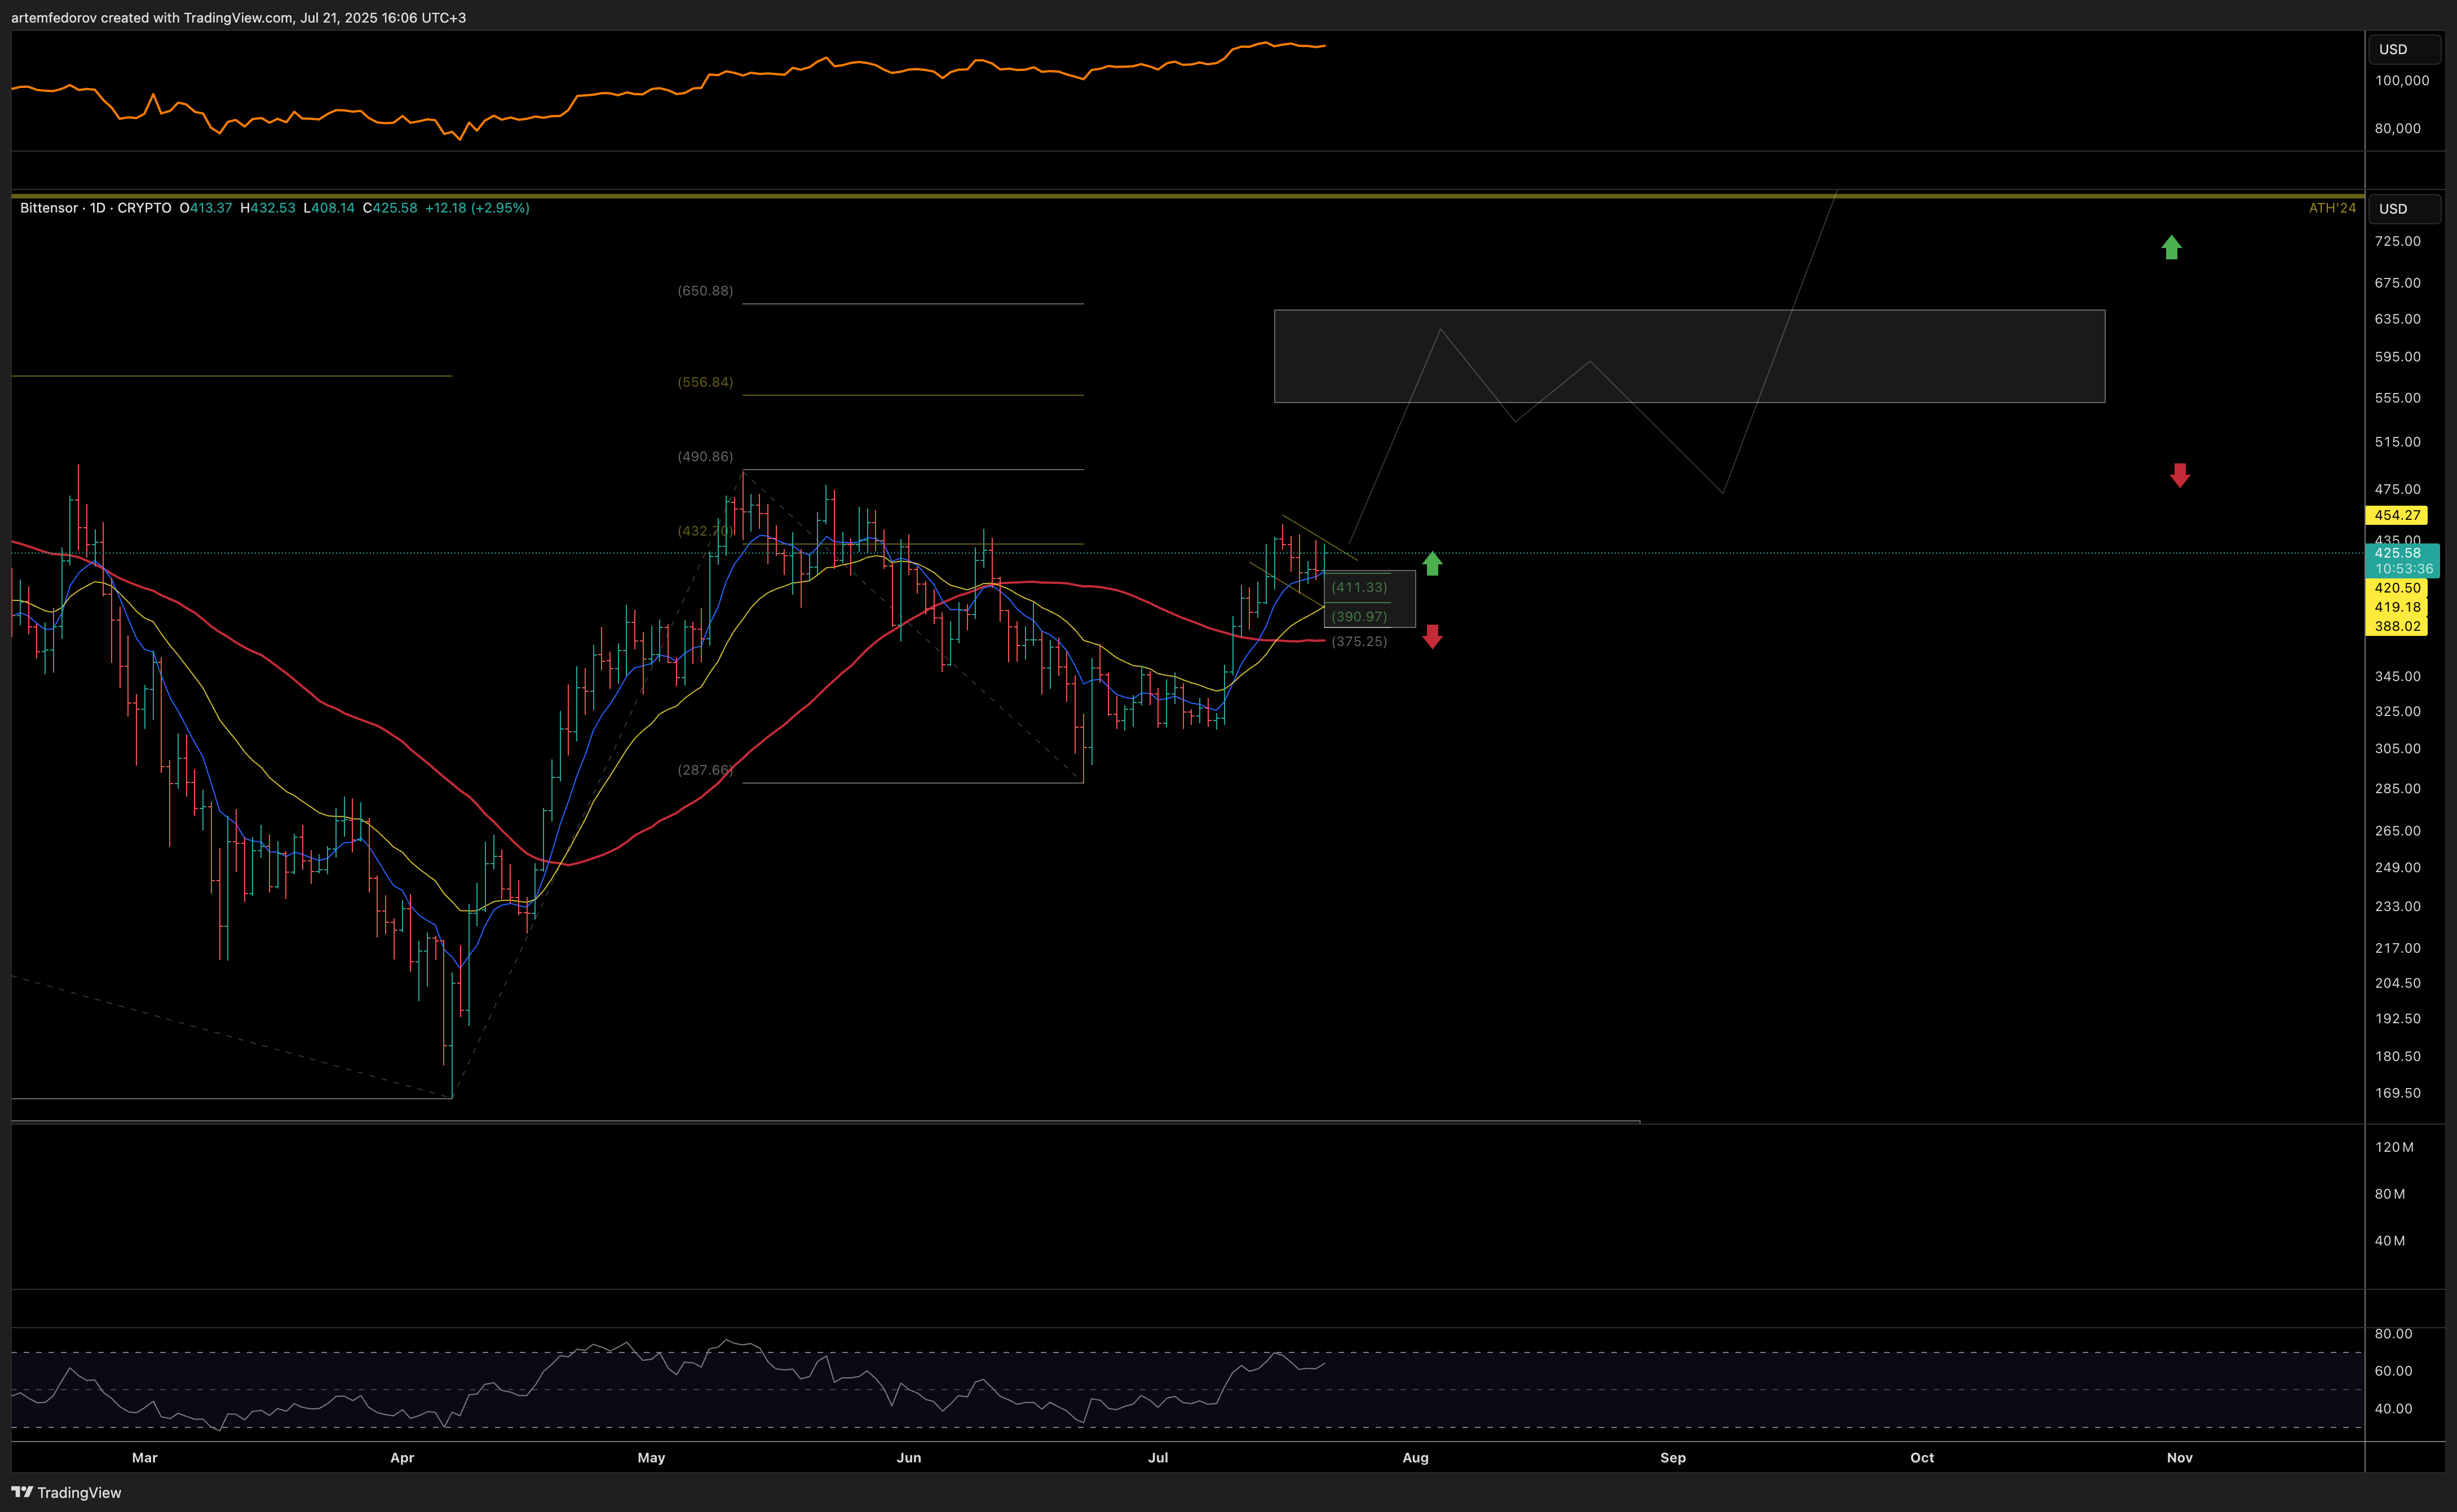
TAOBUSD showing constructive consolidation at local support. The original trend structure thesis remains intact, and as long as price holds above the 375 support zone, I continue to expect upside momentum to follow through into the 500–550 region, with a possible max extension toward 650 in the coming weeks.
TAOBUSD showing a very constructive macro structure.
As long as price holds above the 390–375 local support zone, I see immediate potential for a move toward the 555–650 resistance area in the coming sessions.
TAOUSDTAOUSDTTAOBUSD recently rebounded from the $353 support, a historically significant reaction zone, signaling a potential momentum shift. A breakout above the descending trendline, with a candle close beyond the previous swing high, would confirm a structural change and target prior highs near $668. If $353 fails, the next support at $237 could serve as a strong accumulation zone. The TSI indicator has broken its descending trendline and formed a bullish crossover. While still below zero, a move above this level would reinforce bullish momentum, aligning with historical rebounds from the -22 TSI level. tradingview.com/x/xgKIr2ew/