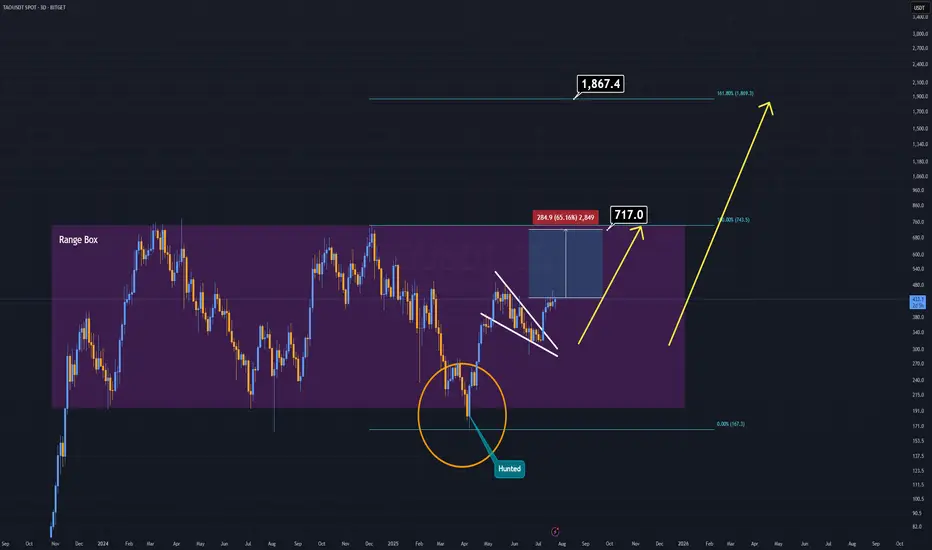
TAO Analysis (3D)Sometimes, there's no need for complex patterns or heavy indicators — and TAO is a perfect example of that.
For years, TAO has been consolidating inside a clearly defined accumulation box. Before the current bullish breakout, it liquidated all weak hands by sweeping the lows — convincing many that the project was dead.
Now, on the daily timeframe, we’re seeing a broken and active pennant formation, which is already being validated.
This structure alone is a strong technical buy signal.
With the upcoming AI-driven bull run, TAO has the potential to outperform many of its AI-sector peers.
This one might just fly ahead of the pack.
TAOUSDT trade ideas
Impatience. Chickening outTrade Journal – TAO, Pengu & the Elusive HYPE
Date 23/7/2025
I don’t trade on Mondays—by design. But today, I honored that discipline *mostly*… with a few strategic pivots.
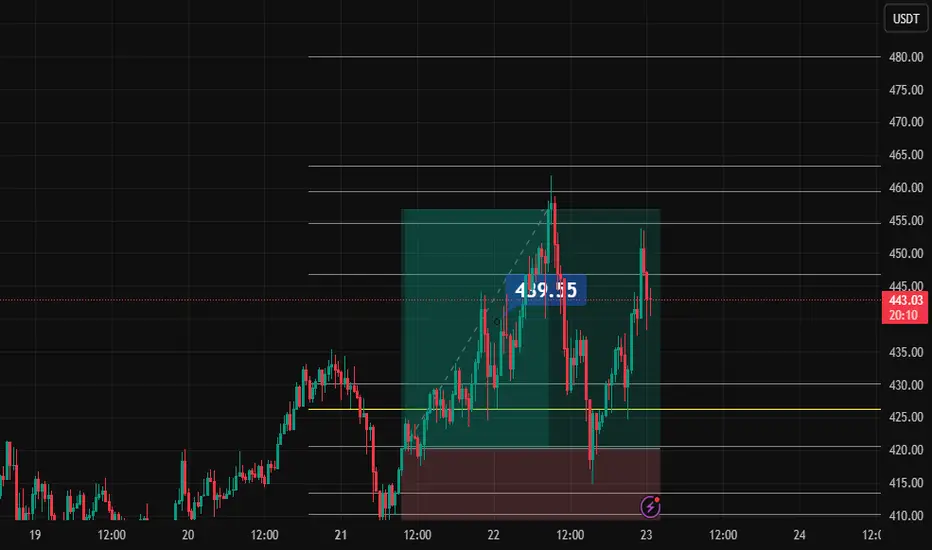
TAO: First Move, First Lesson
I took TAO on Spot early Monday, planning to hold until weekend highs. My bias? After that weekend pump, I expected Monday’s session to seek out those liquidity-rich levels.
By midmorning, I had early profits—more than I’d normally expect for a Monday. With extra charting time and a shift in schedule, I decided to secure gains around **+3%** and move on.
Right idea… maybe wrong execution.
TAO didn’t just continue—it ripped.
Looked back at me like:
> “The hell were you thinking?”
Fair enough. I responded:
> “Chill. This is the volatility zone. I’ll find another one.”
🐧 Pengu: Redemption in Motion
Scanned. Spotted Pengu .
Took it on Spot again—targeting a clean +5%.
Wasn’t worried about drawdowns; I trust the setup.
Only issue? My exchange doesn’t allow pre-queued sells unless I’m actively in the trade—and sometimes, I forget to prep that.
Fast forward: I checked back, and I’m sitting on +10%++.
No hesitation this time—we sold. Clean.
HYPE: The One That Got Away
Next up was HYPE . I had done the work—clean levels, setup looked solid.
Except… not available on my exchange. Again.
Maybe I just couldn’t find it. Or maybe my exchange was playing games. Either way, that trade left the station without me.
Could’ve transferred funds and chased, but I value precision. Rushed logistics aren’t part of my edge.
Price will always come back.
Final Thought
HYPE’s still on my radar.
If it wants to come home to me and take me to TP—door’s open. Limit set, looking for a 15% within the next 15 days.
Until then, I’m letting the market breathe. Discipline + Setup = Process.
TAO's (Bittensor) True Potential Exposed · How About $3,000?Remember when I kept saying these are "conservative targets"? Why should we look for conservative targets when we know the market will do magic in the coming months? Why?
Let's focus more on realistic targets, optimistic targets, strong targets, good targets, successful targets; higher is better, less is not more.
We've been here many times before. I am happy and grateful to be able to count with your continued support. You can count with my analyses, great entry prices and timing. You can count with a unique market perspective 100% free of outside influences. I am not paid through USAID. 100% independent and everything you see is my mind, my soul, my heart and my spirit. It is my understanding of the market based on thousands of charts, thousands of publications, thousands of successful trades and more than a decade of experience. We are here to win and to trade. We trade to win, make no mistake.
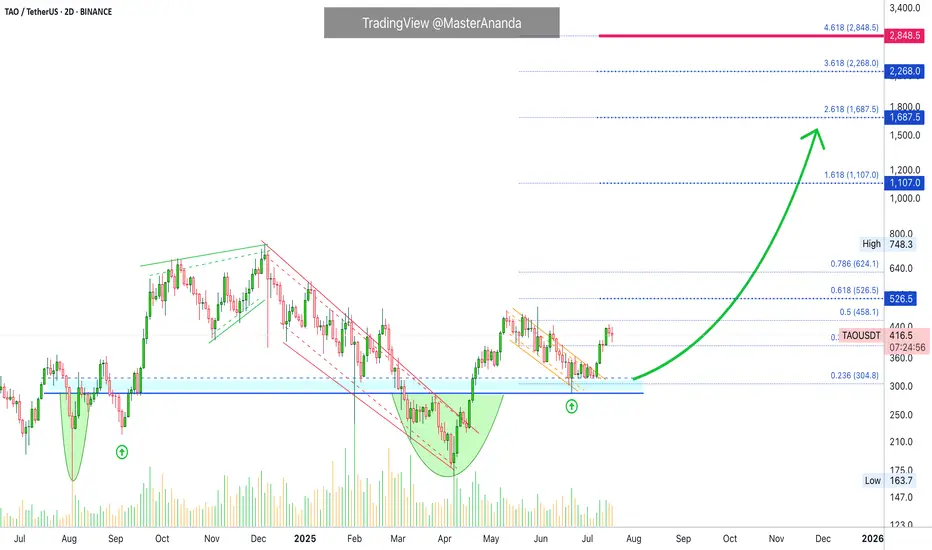
Bittensor's (TAO) bottom is in, a long-term double-bottom; the beauty of TA.
A major low in August 2024. A new low in April 2025. The fact that these two happened at the same price is good news and it is already confirmed. Something as simple as the same level being hit twice helps us predict the future when it comes to the price of this, and others, trading pairs.
With the bottom in we can focus on growth. TAOUSDT is still early considering the bigger picture because the action is still happening below its May 2025 high. But conditions are good, very good I should say, because TAOUSDT is trading daily above EMA55, EMA89 and EMA233, a long-term moving average.
The break just happened days ago. If we are set to experience growth for 3-6 months, minimum, after this signal shows up, this opens the doors for prices much higher to what we've been considering in the past few months.
$1,100 is a good target but an easy hit. Only 30% higher compared to the last major high in December 2024.
$1,687 is the first strong resistance that TAO will face during its bull market bull-run. My bet is that it will break.
Going higher, we can see TAO trading at $2,268 later this year and even higher, just below 3K.
Now, this chart is very young so even while being optimistic we do not have enough data to project higher targets but there is no limit to how far-up a project can go during the price discovery phase. When we enter new all-time high territory and the final fifth (speculative) wave, all bets are off. You can aim for the moon or higher.
Namaste.
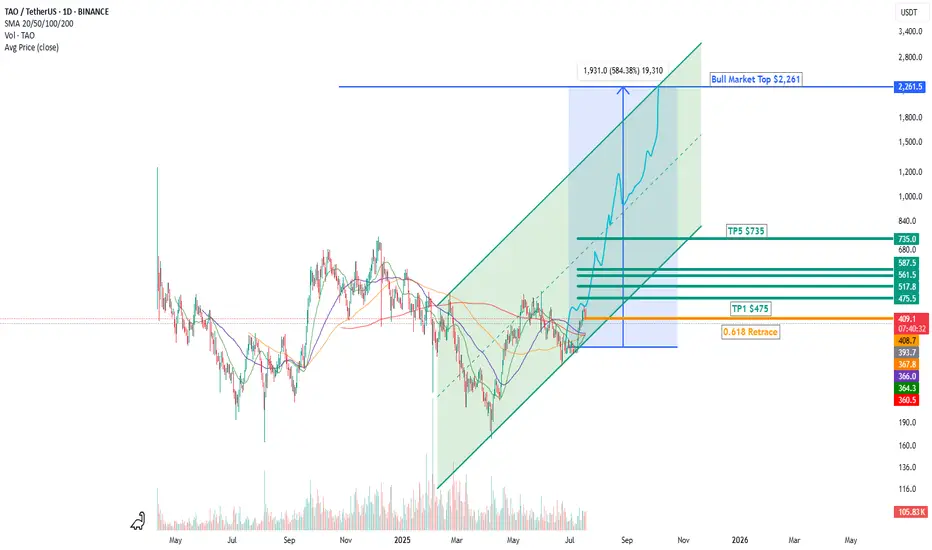
TAO Primed for Liftoff: Crypto AI Juggernaut TP $2,261 6x Min🚀 TAO Primed for Liftoff: Why This Crypto AI Juggernaut Could Be Headed to $2,261 (and Beyond)
The stars are aligning for Bittensor ( GETTEX:TAO ), one of the most structurally important and undervalued assets in the entire crypto AI sector.
📈 Technical Breakout Incoming
Let’s start with the chart. TAO has cleanly bounced off the golden Fibonacci 0.618 retracement—a classic signal that the correction is over and the next bullish impulse is underway. From here, the path of least resistance is up.
The price is hugging the bottom of a well-defined ascending channel. As long as the structure holds, TAO is set to target the next key levels:
✅ TP1: $475
✅ TP2: $517
✅ TP3: $561
✅ TP4: $587
✅ TP5: $735
💥 Ultimate Cycle Top: $2,261 to $2,505
That's a +584% move from current levels — not a meme, but a mathematically clean technical projection. The high timeframe structure supports this move into Q4 2025, where altcoin dominance typically peaks.
🧠 AI + Crypto = Trillions in Flow
TAO isn’t just riding technicals. It’s also the kingmaker of decentralized AI compute. As the base layer that incentivizes AI model training across a permissionless network, TAO is building the future of open-source intelligence—something no other crypto project is doing at this level.
🧬 But here’s where it gets nuclear...
📜 Regulatory Green Lights = Institutional Surge
In the past two weeks, two massive regulatory catalysts dropped:
🇺🇸 The U.S. Congress passed landmark digital asset legislation that legally distinguishes between commodities (like Bitcoin, Ethereum, and AI protocols like TAO) and securities. This unlocks compliance-friendly pathways for major institutional capital to flow into select altcoins.
🇨🇳 China issued regulatory clarity on AI and blockchain convergence, approving several pilot programs that incorporate decentralized machine learning. Bittensor’s model fits perfectly into this new regime, especially if TAO becomes a de facto backbone of Asian open-source AI development.
Together, this sets up a trillion-dollar liquidity wave—and tokens with utility, clear tokenomics, and AI narrative momentum like TAO will be first in line.
💡 Why TAO Stands Out in the AI Meta
✅ Scarce supply: TAO has a capped supply and deeply embedded utility.
✅ Real yield: Miners (subnets) earn TAO by providing real-world machine learning services.
✅ Community-first: Bittensor is open-source, censorship-resistant, and run by a decentralized validator set.
✅ Already powering an entire ecosystem of AI projects (not just vaporware).
🔮 What Comes Next
Expect TAO to grind its way through the targets—$475, $561, $735—and eventually break into parabolic mode toward $2,261–$2,500 as institutional capital rotates out of BTC/ETH and into deep narrative tokens during the cycle blow-off top (likely by late Q4 2025).
If you missed Bitcoin at $1,000 or ETH at $30, this is your second chance.
🧠 TAO is not a trade. It’s the neural backbone of the decentralized AI economy.
📌 Conclusion:
🟢 Technically primed (0.618 bounce, channel structure)
🟢 Regulatory tailwinds (U.S. + China)
🟢 AI narrative apex
🟢 Structural tokenomics
🔵 Price Target: $2,261–$2,505 this cycle
TAO is not just a coin. It’s the protocol layer for the AI-powered internet.
📡 Get positioned. This is where narrative, structure, and capital flow converge.
#TAOUSDT #4h (ByBit) Ascending trendline near breakdownBittensor printed an evening doji star deviation, a retracement down to 200 MA support seems next.
⚡️⚡️ #TAO/USDT ⚡️⚡️
Exchanges: ByBit USDT
Signal Type: Regular (Short)
Leverage: Isolated (5.0X)
Amount: 5.0%
Entry Targets:
1) 430.38
Take-Profit Targets:
1) 362.01
Stop Targets:
1) 464.64
Published By: @Zblaba
GETTEX:TAO BYBIT:TAOUSDT.P #4h #Bittensor #AI #DePIN bittensor.com
Risk/Reward= 1:2.0
Expected Profit= +79.4%
Possible Loss= -39.8%
Estimated Gaintime= 1 week

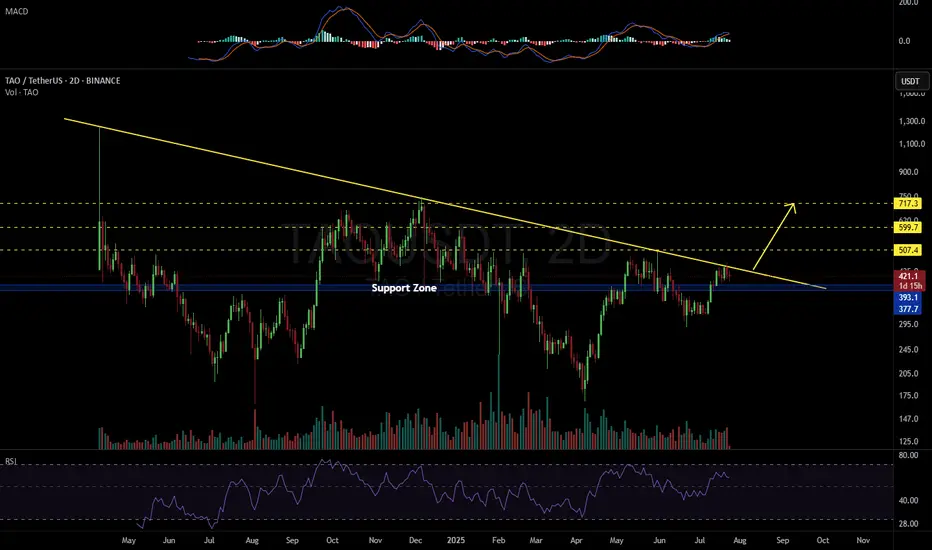
TAOUSDT 2D#TAO is currently testing the long-term descending resistance on the 2-day timeframe.
Partial accumulation at the current level may be considered, with additional entries near the key support zone:
🔹 $393.1 – $377.7
If the price breaks above the descending trendline with strong volume confirmation, the next potential upside targets are:
🎯 $507.4
🎯 $599.7
🎯 $717.3
⚠️ As always, use a tight stop-loss and manage your risk accordingly.
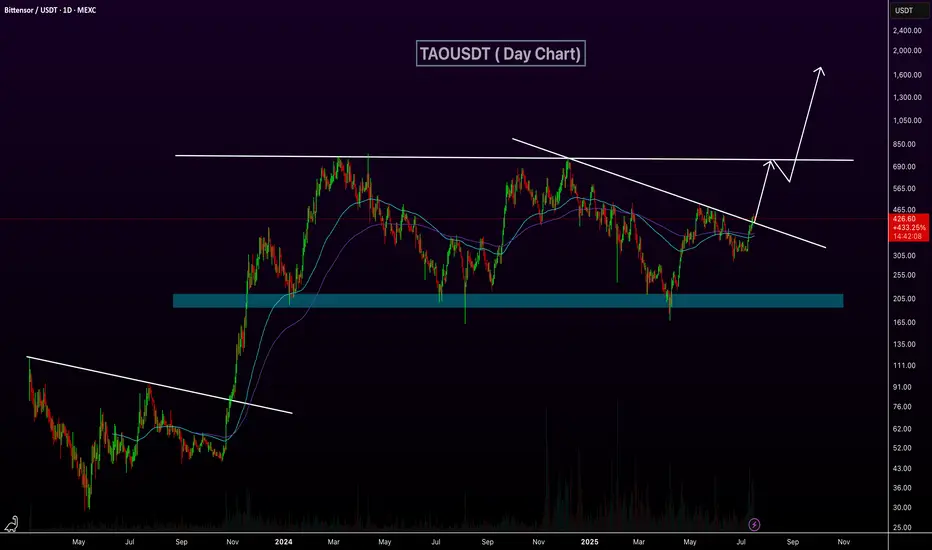
TAOUSDT Breaks Descending Trendline!BINANCE:TAOUSDT daily chart is showing a potential bullish breakout as price moves above a long-term descending trendline. This breakout, combined with support from the 100 and 200 EMAs, indicates growing upward momentum. If price holds above this trendline, the next key resistance lies around the $750 level. A successful breakout and retest could pave the way for a major rally toward $2,000. GETTEX:TAO
Regards
Hexa
TAO It will grow soon...The TAO will increase $60 and reach to the top of the wedge in the coming days .
Best regards CobraVanguard.💚

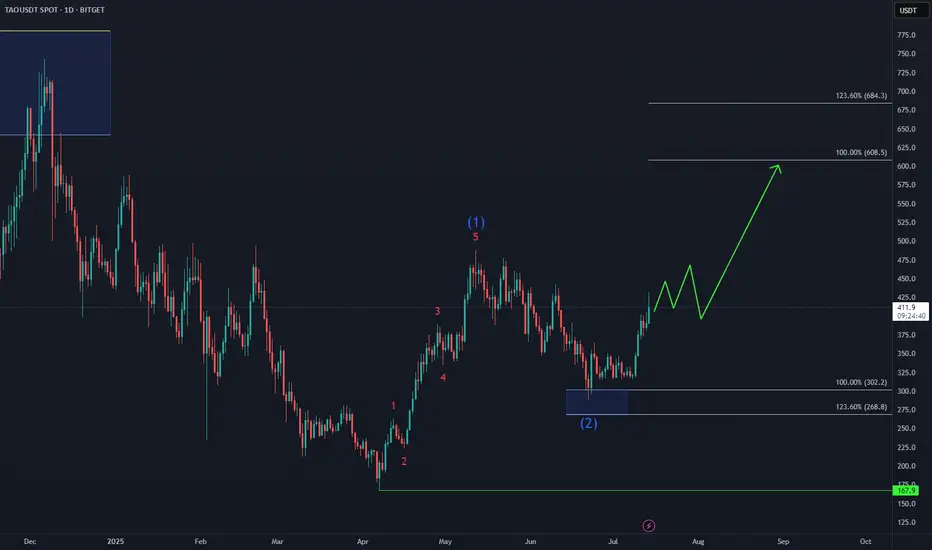
Bittensor TAO Eyes Next Upside Target📈 BINANCE:TAOUSD attracted strong demand in the Blue Box buying zone at $302–$214, triggering the next bullish leg.
Elliott Wave projections now point toward a move into the $608–$684 target area, supported by impulsive structure and rising momentum.
As long as price holds above the recent low, the bullish sequence remains intact.
Bittensor Goes Bullish · $1,107 Price Target Within 6 MonthsHere is a very interesting piece of information. The same 22-June low worked as support back in September 2024. Needless to say, the test of this level propelled a major bullish phase. Conditions are similar now, not the same but similar. Bittensor is stronger now compared to late 2024, so we can expect the bullish wave that follows also to be stronger and thus a $1,107 price target mid- to long-term. Within 3 to 6 months.
Today we have a bullish breakout from the current structure with confirmation of long-term support and the higher low. TAOUSDT is now entering a new wave of growth. This is a long-term event, this wave should last all through 2025 and possibly beyond.
You can find additional details on the chart.
Leave a comment if you have any questions. Follow if you enjoy the content and would like to see more.
Namaste.

Rising Pressure on $TAO, Is the Trendline About to Crack?GETTEX:TAO is gearing up for a breakout 🔥
After weeks of consolidation, RNDR is now moving within a rising structure and pushing against a key descending trendline from the previous highs.
🔍 What the chart shows:
Descending Trendline Resistance: Price has tested this trendline multiple times, a breakout would signal strength.
Higher Lows: Buyers are consistently stepping in early, showing increasing demand.
Tight Price Action: Price is getting squeezed, indicating an explosive move could be near.
Volume: Slight rise in volume suggests growing momentum.
🎯 Trade Setup Idea:
Entry: Break and retest above $330
Stop-loss: Below $310
Target 1: $380
Target 2: $440
A breakout above the trendline could trigger a strong upside move.
DYOR. NFA
GETTEX:TAO BINANCE:TAOUSD BINANCE:TAOUSDT

Tao longBreak on 4h and confirm good for long. We allready try to brake before.
Ne push could be positive.

TAO July 2025 Long High probNext Tao entry from a good risk to reward long position. Waiting for a sweep and close back in the consolidation range, looking for higher prices.
Bring stops to break even quickly when in profit

$TAO, time for this AI coin to start movingIt can do something like this in the coming days, Taking my first bid here, second remaining incase bitcoin dips towards 105.2k. Will keep updating it.

TAO - Bullish Channel - Easy 5-10x🧠 Bittensor ( LSE:TAO ): The AI Infrastructure Play Hiding in Plain Sight
In a crypto market crowded with overhyped narratives and underdelivered roadmaps, Bittensor ( LSE:TAO ) stands out as one of the most structurally sound, undervalued, and long-term scalable tokens in the entire AI x crypto sector. Despite a current market cap of ~$3B, the upside potential remains largely untapped.
🔍 TL;DR: Why Bittensor Could 5–10x From Here
Real utility in the AI stack: decentralized machine learning marketplace, not vaporware
$3B market cap is tiny compared to the trillions flowing into AI infrastructure
Network effects + crypto incentives = exponential flywheel
Tokenomics favor scarcity and network value accrual
Could be the “Nvidia of decentralized AI”
⚙️ What is Bittensor?
Bittensor is a decentralized network for machine intelligence. Instead of siloing AI development inside closed corporate labs (like OpenAI or Anthropic), Bittensor incentivizes open-source contributors to train and provide AI models to the network.
It’s a proof-of-intelligence protocol where miners contribute compute and models, and are rewarded in LSE:TAO tokens based on the quality and usefulness of their output.
Think of it as:
“A decentralized, crypto-native version of HuggingFace + OpenAI + AWS rolled into one trustless protocol.”
🧠 The LSE:TAO Bull Case
1. Massive Market Tailwinds
The AI industry will exceed $1.8 trillion by 2030 (PwC, Bloomberg estimates)
Current AI infra is centralized and bottlenecked (e.g., API limits from OpenAI, model censorship, GPU shortages)
Bittensor taps into the open-access, decentralized future of AI, where censorship resistance and incentive alignment matter
Even a 0.1% capture of AI infrastructure spend = $1.8B/year in value flowing through TAO.
2. Superior Token Design
LSE:TAO is the fuel for both training and inference — all compute value flows through it
Scarcity baked in: 21 million max supply (same as Bitcoin)
Inflation rewards productive nodes, meaning value is tied directly to performance and adoption
Validators and miners stake TAO — creating constant buy pressure from participants who need skin in the game
TAO is not a meme — it’s an incentive layer for decentralized intelligence.
3. Network Effects Just Beginning
TAO ranks and rewards subnetworks based on model performance, sparking competition
As more builders contribute models, the value and intelligence of the network improves
Early movers get rewarded heavily (like Bitcoin in 2011 or Ethereum miners in 2016)
Low retail awareness right now = asymmetry for early investors
4. $3B Market Cap Is Misleadingly Small
For context:
Chainlink ( BIST:LINK ) = $11B cap with no real network effect
Arweave = ~$2.5B for decentralized storage
OpenAI (private) = $80B+ valuation
Nvidia = $3T+ valuation with GPU dominance
TAO offers something none of them do: a decentralized, monetizable brain — and it’s only just starting to scale.
A move to $15–$30B (5–10x from here) is conservative if Bittensor becomes the de facto decentralized AI coordination layer.
5. The Right Narrative at the Right Time
AI + crypto is the most investable narrative of this cycle
TAO is the only AI token with real compute and learning on-chain
VCs and institutions are increasingly looking for AI token exposure — and TAO is one of the few with a credible moat
🏁 Final Thoughts
If you're looking for a conviction trade that combines crypto-native scarcity, real-world AI utility, and explosive upside in a still-underappreciated niche, Bittensor is that play.
It’s not just another token riding the AI hype. It’s an ecosystem building the future of decentralized intelligence — with a token that rewards performance, scales with adoption, and is designed to accrue real value.
In a world where data is the new oil, Bittensor is building the decentralized refinery.
Disclosure: As always, do your own research. But in a space full of noise, LSE:TAO is one of the few tokens that could genuinely outperform 5–10x from here — and still have room to run.

TAOUSDT Long Setup from Fibonacci 0.382 and Trendline ConfluenceTAOUSDT has retraced into a strong confluence zone combining the 0.382 Fibonacci retracement level ($316.99) and a long-term ascending trendline. This area is often considered a high-probability bounce zone in bullish market structures.
A long position was entered at $316.52, anticipating a continuation of the uptrend toward the previous swing high near $364.83.
The setup offers a high reward-to-risk ratio, with a tight invalidation level below recent structural support and Fibonacci level.
🧩 Trade Parameters:
- Entry: $316.52
- Stop Loss: $303.84
- Take Profit: $364.83
- Risk: $12.68
- Reward: $48.31
- Risk:Reward Ratio: 1 : 3.81
✅ Bias:
Bullish continuation after a healthy correction
🔄 Confirmation:
Strong price reaction or bullish candle from the 0.382 Fib and trendline support
❌ Invalidation:
Clean break below $303.84 (structural and Fib support)

TAO/USDT Potential Reversal Zone – Major Bounce OpportunityTAO/USDT is currently testing a critical support zone (highlighted in yellow) between $220 – $280, which has historically acted as a strong accumulation area. The price has shown multiple reactions from this region throughout 2024 and 2025, signaling that bulls may be preparing for a reversal.
🔍 Key Technical Levels:
Major Support Zone: $220 – $280
Immediate Resistance Levels:
$350.9
$462.9
$560.8
$600
$719.1
Long-Term Resistance: $780 (local high)
🔄 Scenario: If TAO successfully holds this support zone, a bullish reversal could be triggered with a potential rally toward the $350 level first. A break and retest above this could open the door for a sustained move towards $560 and beyond. The bullish projection is illustrated with the yellow arrow path, showing a potential multi-stage rally through key Fibonacci and structural levels.
📉 Invalidation: A confirmed break below $220 would invalidate this bullish setup and could push TAO toward lower lows, potentially retesting $170 or even $127 support levels.
📌 Summary: TAO is approaching a historically strong support base. If the structure holds and volume supports the reversal, we could see a powerful leg up toward $560 and possibly $719 in the medium term. Risk management is essential, especially with volatility around macroeconomic events and Bitcoin price movements.

TAO looking for a bullish confirmation. TAO retracing for a confirmation low is bullish. The real concern is that this turns into a dead cat bounce and the price makes a LL. As long as the price stays above the previous low, as momentum and trend oscillators get oversold, the structure is intact.
Full TA: Link in the BIO

TAO/USDT | Long | DeAI Infrastructure Play | (June 23, 2025)TAO/USDT | Direction: Long | Key Reason: DeAI Infrastructure Play & Technical Recovery | (June 23, 2025)
1️⃣ Insight Summary
TAO has been in a downward channel, but it's now approaching a key zone of interest where support, volume, and structural value overlap. With fundamentals in decentralized AI, it could present a high-upside swing opportunity if the trend flips.
2️⃣ Trade Parameters
Bias: Long
Entry: Around 343.00
Stop Loss: Below 265.00 (previous point of control & structural low)
Take Profit 1: 387.00
Take Profit 2: 425.00
Take Profit 3: 483.00
Extended Targets: 574.00 / 668.00
3️⃣ Key Notes
✅ Fundamentals remain intact – Despite recent price correction, Bittensor’s core value proposition as a decentralized AI marketplace remains.
✅ Layer-1 infrastructure – Built specifically for AI model training, compute exchange, and monetization—all backed by its native blockchain.
✅ Strong community – Active developers, validators, and AI miners; over 75% sentiment bullish across social platforms.
✅ Institutional interest – DCG invested $100M in TAO, launching “Yuma” as an ecosystem builder on top.
❌ Risk alert – Past security issues ($8M exploit), and leadership clarity is limited (no public founder presence).
⚠️ Technical caution – Price is still under pressure; a clean flip of VWAP and volume zones into support is key before full confirmation.
4️⃣ Follow-up Note
I’ll monitor how TAO reacts to the value area low and VWAP. If price confirms a base above $387 with sustained buying, we’ll reassess for a move toward $574 and beyond.
Please LIKE 👍, FOLLOW ✅, SHARE 🙌 and COMMENT ✍ if you enjoy this idea! Also share your ideas and charts in the comments section below! This is the best way to keep it relevant, support us, keep the content here free and allow the idea to reach as many people as possible.
Disclaimer: This is not financial advice. Always conduct your own research. This content may include enhancements made using AI.

TAO the beginning of an epic BULLRUN!🚀 LONG on LSE:TAO – Perfect Confluence Setup
TAO has just completed a textbook ABC corrective wave, retracing precisely to the 0.618 Fibonacci level of the April–May bullish 5-wave structure.
What makes this setup even more compelling:
✅ That 0.618 retracement also converges with the 0.786 Fibo of the larger corrective move that started back in December ‘24.
✅ We’re likely at the start of wave 3 of a higher time frame impulsive structure — the most explosive leg.
🎯 Target: $605 — the 1.618 Fibo extension of the recent ABC correction, which aligns with the 0.236 retracement of the macro move from December.
📉 Stop Loss: $220 — placed below wave 2 for structural invalidation.
📊 Risk/Reward Ratio: ~4.5R — excellent setup.
I love it when the Fibs align. 🔥
Fingers crossed for liftoff!


TAO MOVE IN BOXES - WHICH BOX IS NEXT? UP OR DOWN?Which box do you think is next? The one above or the one below?
TrAde with Caution!
Follow for real-time analysis as this plays out

TAO - Price Action Played out as called Called this short setup last month at $417 and it's currently at $302.47. Still doubting the setup?
Follow for real-time analysis as this plays out
