Here I buy Bittensor at $700Time to Buy Bittensor at $700
And Bittensor supply shock is happening here before your eyes.
Watch out
The whale-shark is coming to swallow all bearish sardines
with their useless charts searching for the big correction.
First they come after me pumping crypto in Los Angeles
But when they think I'm still in Los Angeles, I'm already pumping crypto in Chicago
And when they come after me in Chicago, I'm in already pumping crypto in NYC
But don't try to go after me in the south pumping
'cause the only city you can find me in the south is Miami
TAOUSDT trade ideas

IHS for TAO USD bullish continuationthis chart which shows a H&S pattern on Bittensor TAO suggests further downward movement on the inverse (i.e. growth of TAO in USD terms)

TAO Cup & Handle patternTAO has formed the technical structure of the Cup & Handle pattern. I drew an analogy with ADA. This asset formed the Cup & Handle pattern in the same phase of the cycle, but in 2020 and showed growth of more than 6X.
I conducted all the technical analysis on the chart and identified a target of $1,327. But the pattern is only one of the arguments for taking profit. It will be necessary to assess the dynamics of the asset’s movement and only then make a comprehensive decision about partial or full profit-taking.


TAO/USDT: Potential 2x Move in the Making!🌟 Hey everyone! 👋
If you’re finding value in this analysis, don’t forget to smash that 👍 and follow for more high-value trade setups! 💹
🔍 Technical Overview:
TAO is looking incredibly strong! It’s breaking out of a cup and handle-like pattern on the daily time frame, and the current retest of the neckline makes it a prime opportunity for entry. This setup suggests a high probability of a 2x move, making it a must-watch! 📈
💡 Entry Strategy:
Entry Range: CMP (Current Market Price) and add more up to $600.
Targets: $900 / $1,200 / $1,600 / $2,000
Stop-Loss: $540 (Set tight for risk management).
Leverage: Spot or low leverage (Max 3x for risk control).
📖 Fundamentals of TAO Token:
TAO is the native token of the Lamina1 blockchain, a project co-founded by Neal Stephenson, the creator of the term "Metaverse." Lamina1 is purpose-built to power the Open Metaverse economy, providing developers and creators with the tools to build decentralized, immersive experiences.
Key Use Cases of TAO:
1️⃣ Powering the Lamina1 ecosystem.
2️⃣ Facilitating transactions and smart contracts within the Open Metaverse.
3️⃣ Incentivizing developers and creators on the blockchain.
💬 What’s your take on TAO’s setup? Are you spotting the same breakout potential, or do you have a different perspective? Drop your thoughts and analysis in the comments below, and let’s crush this trade together! 🚀🔥

#TAO/USDT Ready to go up#TAO
The price is moving in a descending channel on the 1-hour frame and sticking to it well
We have a bounce from the lower limit of the descending channel, this support is at 638
We have a downtrend on the RSI indicator that is about to break, which supports the rise
We have a trend to stabilize above the moving average 100
Entry price 651
First target 661
Second target 673
Third target 686

TaousdtHi. We see a nice cup & handle
Two main target is in chart but need to break up main resistance 660~680

TAO Cup and Handle bullish set upTAO is forming a cup and handle in the 3 days chart.
It is currently breaking out of the falling wedge.
A break above $682 will send TAO flying to $1,200 - $1,250 in the immediate short time.


Is TAOUSDT Ready to Skyrocket? The 250% Opportunity Awaits!The big picture is coming together for TAOUSDT, and it’s looking explosive! Let’s break down this visually stunning setup that could catapult this asset by an incredible 250%. Are you ready to ride this wave? Here’s why this could be a game-changing breakout:
1️⃣ The Perfect Rounded Bottom Formation
The chart paints a classic rounded bottom, a powerful bullish reversal pattern.
Key Support Zone : TAOUSDT built a solid foundation within the support area, tested multiple times for strength.
Steady Volume Accumulation: The increasing volume during the base formation hints at smart money quietly entering the market.
This setup signals that momentum is building, and the next leg up is in sight.
2️⃣ Breakout from the Bullish Flag
After the rounded bottom, the market formed a bullish flag, a textbook continuation pattern. This flag represents a brief consolidation phase, preparing for the next explosive move upward.
Volume Surge : Notice how volume spiked at the breakout point? That’s confirmation of buyer interest stepping in.
Momentum Reset : The consolidation allowed TAOUSDT to cool off, priming for a much bigger move ahead.
3️⃣ The Target: A Staggering 250% Move
The measured move projection for this breakout is 1,800$, representing a massive 250% gain from current levels. With the pattern's precision and volume confirmation, this target becomes a realistic possibility.
Here’s why this move could be the real deal:
✅ Rounded bottom = trend reversal signal.
✅ Bullish flag = continuation of momentum.
✅ Exceptional volume = confirmation of strength.
4️⃣ What Traders Should Watch For
💡 Key Support Zone: If the price retests the green support area around 470-500, it could offer a golden entry opportunity.
💡 Breakout Continuation: A clean break above the recent highs of around 640 will confirm that the momentum is intact.
💡 Volume Spike: Sustained volume will fuel this potential 250% rally.
Conclusion: A Bullish Wave is Loading! 🌊
The TAOUSDT chart is screaming opportunity, with a rounded bottom, a bullish flag, and exceptional volume setting the stage for a parabolic move. With a 250% target on the horizon, now is the time to stay sharp and capitalize on this explosive setup.
🚨 Don’t just watch the move – position yourself for it. TAOUSDT is ready to make history. Are you? 🚨

$TAO AI SEASON LEADAI will lead the crypto to new level of adaption as it is given since the first run.
all tech integrates A.I soon and its inevitable.
everything will run on it.

TAOUSD - Bullish Temporary Chart shows a sort of inverted H&S structure
I see the right shoulder providing an escape from this bear point out of an inverted H&S
We are in a bull market regardless
First time ive looked at this coin but I do think all coins will pump during this alt run
Daily chart

TAO goes to 800
Hey everyone!
BINANCE:TAOUSDT completes the fifth wave. Target - 700 - 800 dollars per coin.
Shaka 🤙

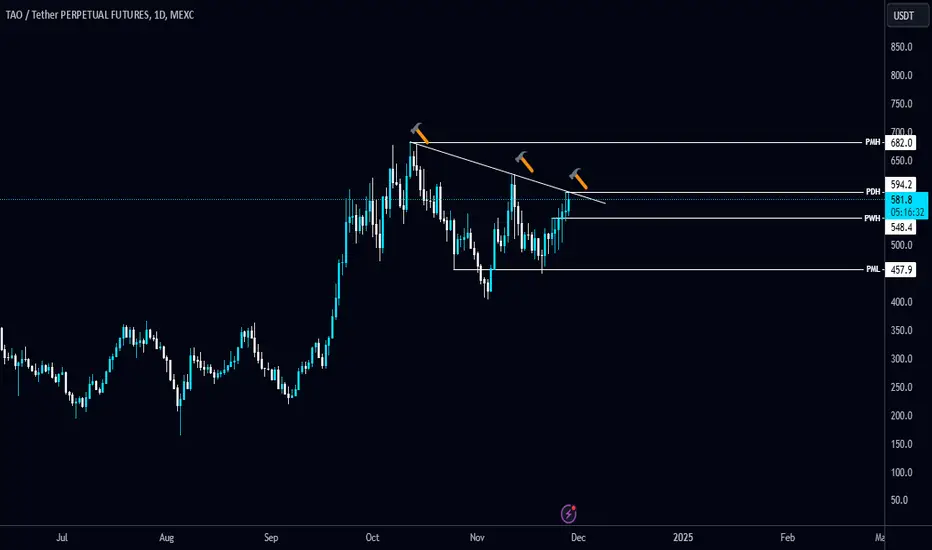
Keeping an eye on the #TAO/USDT Diagonal Trendline in Daily TF!Keeping an eye on the #TAO/USDT Diagonal Trendline in Daily TF!
So far facing resistance here. Wait for BO/retest to long it. The local resistance level is PMH $682 and the support level is PML $457.9.

TAOUSDT 1WGETTEX:TAO ~ 1W
#TAO History will continue to repeat itself. if you have Conviction on this coin,. Buy after this Resistance Block has been successfully penetrated. with a minimum target of 20%+

TAO - Looking good for new ATH before EOYTAO is pushing for new all time high after retesting on 0.75 fib level. TAOUSDT

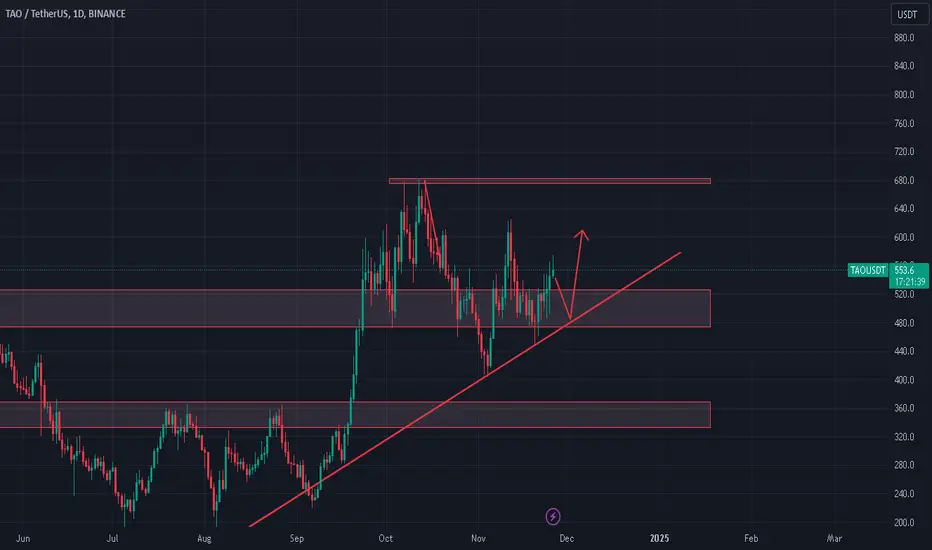
$TAO/USDT Trading IdeaTAO has formed a bull flag on the daily timeframe, but keep an eye on the ascending support. If a breakdown occurs, we could see a retracement.

Bittensor (TAO)📊 General Overview of the Analysis
TAO coin, after being listed, initially moved downward within a descending channel. Upon breaking out above the channel, the price experienced an upward rally to its previous peak but then entered another descending channel.
🕰 Daily Timeframe Analysis
🔸 Current Status: After the upward movement, the price has entered a consolidation range (yellow zone).
🔸 Fake Move: The drop below this range suggests seller weakness.
🔸 Forecast: Breaking above the yellow zone could propel TAO to higher levels.
⏰ 4-Hour Timeframe Analysis
🔹 After rebounding from the top of the descending channel, the price responded positively to the midline and rose again.
🔹 Expected Movement: There’s potential for breaking out of the descending channel from the top.
🔹 Suggested Entry Point:
A confirmed price stabilization above the red zone can signal a secure entry.
🎯 Price Targets (Fibonacci Levels)
🔹 1.618
🔹 2.618
📈 RSI Indicator Analysis
🔸 On the daily timeframe, RSI is positioned in an ascending channel.
🔸 Forecast: A breakout above the midline of this ascending RSI channel could offer an early entry signal for TAO.
📝 Conclusion and Final Note
Technical analysis indicates that TAO has significant potential for further upward movement. Stabilization above the red zone and movement toward Fibonacci targets highlight the coin's appeal for long-term trades.
💡 Advice: Always employ risk management and incorporate your personal analysis into decision-making.
💡 Reminder: This analysis is for educational purposes only and should not be considered as financial advice.

TAOUSDT #tao bulish or range bulishif we wont see any unpredictable things or accidents TAOUSDT can touch TP1 TP2 and ....#tao 1600$

Eyeing $TAO for the Next Big Move – AI is Next!Giving this one a separate trade. It looks prime for a push up.
BTC is still holding steady above 96k, and AI is lagging behind a bit, so it's time for a push!
Bids are set, and I’ve bought some. It’s sitting above the monthly open... so.
BINANCE:TAOUSDT

TAO movement for DecemberSometimes, things are too obvious. If you don't win please dedicate yourself to another thing.
Not financial advice. Trust only in yoursef.
