TAO priceBittensor (TAO) has noted a falling channel breakout and has revealed an up move beyond the 50 day EMA, suggesting a rally ahead.
TAOUSDT trade ideas

TAO - DOT fractalTAO looks like it will pull a DOT fractal.
Something to watch to see how it develops.

TAO - run it up script TAO in the final bottoming stages.
Same script as before for the shake out with some manufactured FA


A GOOD HOLDING: TAOTAO is a good AI cond that I am holding for the long term. I accumulated some spot in this range and on lower timeframe we can see a nice rejection of this lows. I expect an up only season from now (In case price will drop more, I'll DCA) and I have a final target around $1300

TAO long monitoringPretty soon about 20th of July earliest we could have a very good HTF setup for a TAO long

TAO LOOKING FOR A 12H HL IN H OS , AFTER BIG MOVE OFF OF LOWS. TAO huge H falling wedge into the Fair value gap left on the 12h. and backtest of prior VA after strong breakout !
LOOKING FOR A LONG from FVG into POC. trading it like a wedge. flipping partials . reloading orders lower,

TAO lows might be inA fractal that I following on TAO for a potential bottom forming in this area.
HTF closes above 300 would add to conviction.

Bittensor Price Prediction: Will TAO Crypto Break Resistance?MEXC:TAOUSDT has displayed notable bullish momentum over recent sessions, with closing prices moving from $259.5 to $264.9. This consistent upward trajectory is supported by the 9 and 20 EMAs, which have been trending higher, indicating a strong short-term and medium-term bullish trend.
Current price action suggests that the Bittensor price is poised to challenge critical resistance levels. Immediate resistance is observed at $282.8, with further resistance at $287.4 and $287.5.
A successful breach of these levels could signal a continuation of the bullish trend, potentially driving prices higher. On the downside, support is solid at $264.4 and $256.0, with a more substantial support level at $214.5. These levels will be crucial for traders looking to enter long positions, as holding above these supports would reinforce the bullish outlook.
MACD values indicate a strong bullish momentum, with the MACD line consistently above the signal line and the histogram showing positive values. This suggests that the current uptrend is gaining strength. Meanwhile, the RSI, currently in the mid-60s, is approaching overbought territory. However, it still has room to grow before indicating an overbought condition. This suggests that there is potential for further upward movement.
For traders looking to capitalize on the current bullish momentum, entering long positions at or near the support levels of $264.4 and $256.0 could be advantageous. Exit points around the resistance levels of $282.8 and $287.4 could then be set. Conversely, if the price fails to hold above the support levels and begins to show signs of a reversal, short positions might be considered, targeting the lower support at $214.5.
In conclusion, the TAO crypto exhibits a strong bullish trend supported by positive technical indicators and clear support and resistance levels. Traders should watch for price action around these key levels to identify potential entry and exit points.

TAOUSDT.PTAOUSDT.P is in bullish trend.
Potentially printing HH and HL.
No sign of reversal
We buy at CMP

Bittensor Price action - Possible Cup and Handle setupThe price of Bittensor is still dangling at around the order block I previously mentioned at $245/TAO, and it seems that the order block acts as a nice support. A cup and handle pattern has also formed and checks out beautifully in the 4h time-frame as well.
Price is still moving below both 50 and 100 Moving Averages. RSI is oversold.
If it breaks the cup and handle downtrend, expect prices to drop to $185/TAO
If the price follows the cup and handle pattern, I'm expecting we break out of the triangle towards $500/TAO again. Let me hear your thoughts and opinions.

TAO/USDT Technical Analysis in a Daily Timeframe.Hello everyone, I’m Cryptorphic.
For the past seven years, I’ve been sharing insightful charts and analysis.
Follow me for:
~ Unbiased analyses on trending altcoins.
~ Identifying altcoins with 10x-50x potential.
~ Futures trade setups.
~ Daily updates on Bitcoin and Ethereum.
~ High time frame (HTF) market bottom and top calls.
~ Short-term market movements.
~ Charts supported by critical fundamentals.
Now, let’s dive into this chart analysis:
Since early April 2024, TAO has dropped by 68% and may fall further by 20%-25%, reaching lower support levels between $194 and $217.
A rebound can be expected after hitting these support levels. This rebound will likely push the price back to its ATH target of $777, gaining almost 260%.
Here are the key observations:
~ Strong support/Entry: $194 to $217.
~ Primary Resistance: $287 to $306.
~ Potential rebound/Target: $777 (All-time high).
~ RSI: Slight increase in momentum from the oversold area, indicating a bullish scenario.
~ Invalidation point: A breakdown and close below the support level.
DYOR. NFA.
Please hit the like button to support my content and share your thoughts in the comment section. Feel free to request any chart analysis you’d like to see!
Thank you!
#PEACE

TAO 1DGETTEX:TAO is breaking out falling wadge on 1D TF. We can expect some good returns over here.
DYOR. NFA.

TAO priceTraded in the downward trajectory, Bittensor (TAO) witnessed massive correction and reflected no buying in the past months.

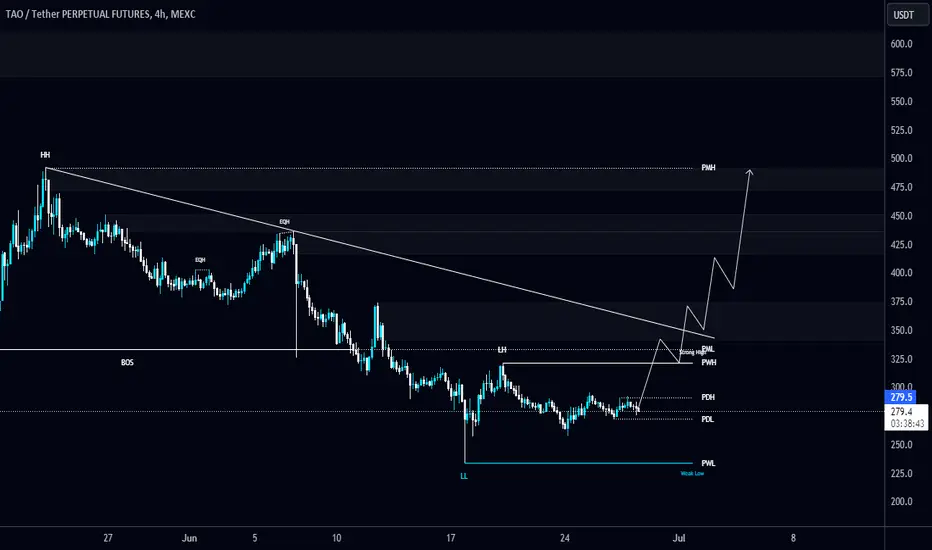
#TAO/USDT needs to break the Diagonal Trendline to turn bullish #TAO/USDT needs to break the Diagonal Trendline to turn bullish in 4-Hour TF!
GETTEX:TAO local resistance level is PWH $322. #TAOUSDT local support level is $265.
TAO long scenarioRecent bottom structure looks very similar to last one
Thinking there is a chance to go in a similar manner that would mean ATH sometime in August
Monitoring on LTF too but HTF is good for context

TAO long scenarioRecent bottom structure looks very similar to last one
Thinking there is a chance to go in a similar manner that would mean ATH sometime in August
Monitoring on LTF too but HTF is good for context

Bittensor - Potential Play of the CenturyA very positive trend is forming for TAO.
It could still retest $301 if all goes wrong, but this is a wonderful time to accumulate even more before the pump commences.
Consider buying before it goes ballistic.
Fundamental Analysis:
||AI Prompt asking ChainGPT several questions about the project.||
Bittensor (TAO) is a cryptocurrency that was launched in 2021. It operates on its own blockchain and has a current supply of 6,897,714 tokens. The token has a maximum supply of 21,000,000 tokens.
In terms of price, Bittensor has experienced a positive trend recently. Over the last 24 hours, the price of TAO has increased by 2.66%. It is currently trading on 65 active markets with a total trading volume of $43,645,031.99. (2024.06.07)
Bittensor aims to provide a decentralized AI network that enables developers to build and deploy AI models. The project focuses on creating an ecosystem where AI models can be trained and utilized in a decentralized manner.
The team behind Bittensor is dedicated to developing cutting-edge technology and has a strong focus on research and development. The project has gained attention in the crypto community, with positive sentiment surrounding its potential.
In terms of its launch, Bittensor was introduced to the market in 2021. It operates on its own blockchain, which is built using the Substrate framework. Substrate is a modular framework developed by Parity Technologies, and it allows developers to create purpose-built blockchains. Bittensor's blockchain is designed to facilitate a decentralized machine learning protocol, where machine learning models owned by different individuals around the world can work together to process information and provide intelligent responses.
The launch of Bittensor's blockchain and the subsequent adoption of its network have provided opportunities for decentralized AI development and services. By leveraging token-based incentives and a decentralized marketplace, Bittensor aims to create a sustainable and participatory ecosystem for machine learning models.
Sure! Bittensor is like a special language that helps computers talk to each other and do really smart things. It's part of something called blockchain technology, which is like a big digital book that keeps track of all the important information.
Now, imagine you have a bunch of computers all over the world. These computers can do really cool things like understand and analyze human language, recognize images, and even make predictions. But sometimes, these computers need to work together to solve really complex problems.
That's where Bittensor comes in. It helps these computers communicate with each other and share their knowledge. It's like a secret code that allows them to understand each other and work together. This way, they can combine their brainpower and solve problems faster and better than they could on their own.
But why is this important? Well, by using Bittensor, we can create powerful artificial intelligence (AI) systems that can help us in many ways. For example, they can help doctors diagnose diseases, predict the weather, or even create new inventions.
And the best part is that Bittensor is decentralized, which means that no single person or company controls it. It's like a big team of computers working together for the benefit of everyone.
So, in simple terms, Bittensor is a special language that helps computers talk to each other and work together to solve really smart problems. It's like a superpower for computers that makes them even smarter and more useful.
||MAIN TAKAWAYS from Pitchbook.com||
Who is the founder of Bittensor?
Jacob Steeves and Ala Shaabana Ph.D are the founders of Bittensor.
Who is the CEO of Bittensor?
Jacob Steeves is the CEO of Bittensor.
Where is Bittensor headquartered?
Bittensor is headquartered in Toronto, Canada.
What is the size of Bittensor?
Bittensor has 32 total employees.
What industry is Bittensor in?
Bittensor’s primary industry is Media and Information Services (B2B).
Is Bittensor a private or public company?
Bittensor is a Private company.
What is Bittensor’s current revenue?
The current revenue for Bittensor is unknown.
Who are Bittensor’s investors?
Collab+Currency, Gravity Fund, NGC Ventures, OSS Capital, and Creative Destruction Lab are 5 of 9 investors who have invested in Bittensor.
Who are Bittensor’s competitors?
OpenAI is a competitor of Bittensor.
Conclusion:
We are dealing with the biggest technological shift of our time. I really don't know what else is more crucial than a technology that is so disruptive even governments now want to put regulation in place to stop its proliferation. A new nuclear weapon is here, and my money is on unstoppable AI, Bittensor! Let's go!

$Tao's Falling Wedge... Resistance/Support Flip?#TAO price action current in a falling wedge...
All time high $795
Tao Bittensor has retraced almost 60% from it's all time high to it current price of $375 forming a double bottom - Previous Resistance is now support!
Expect test of past resistances!
Up resistances: 479, 578, 659, 752 then 847, 938, 1070.
Invalidation under 340 support!
Supports under $340: 285, 224.

TAO's best strategy right nowGETTEX:TAO
DCAing from here until $170.
For those who missed GETTEX:TAO , it will take at least three more months. The markdown phase hasn't ended yet, and then the accumulation phase will come. But in the end, it will reward very high!

TAO (Y24.P2.Video1). Bearish and Bullish levels of interestHi Traders,
I have a number of scenarios where I"m looking to either short or long, with given TA reasons.
Please give me a like and share , thx.
Regards,
S.SAri

More downside Tao tried to break out of the down trend but again failed.
Bottom right now looking somewhere in the mid 200's, maybe lower!
Until we see a break out of this channel there's more room for downside.
Stay patient!

Rotate Within Narratives for Improved ROIThis chart shows TAO priced in FET, both considered "AI projects".
Both coins performed well relative to the market, but also against each other (as the chart shows).
Retrospective strategy: Portfolio $10k.
25 Oct '23: Buy TAO @ $75. (133 TAO). Current price of FET $0.3.
15 Feb '24: Sell TAO > USD @ $679 = $90,533
15 Feb '24: Buy FET @ 0.68 (133,137 FET)
1 Apr '24: Sell FET > USD @ $3.08 = $410,062
The pattern may or may not repeat, but if the AI narrative heats up again, watch for TAO to lead FET, and then rotate at resistance on the pair chart.
