UniversOfSignals | TAO, an AI-focused cryptocurrency currentlyLet's take a quick look at TAO, an AI-focused cryptocurrency currently with a market cap of $138 million, ranked 36th in the coin market cap.
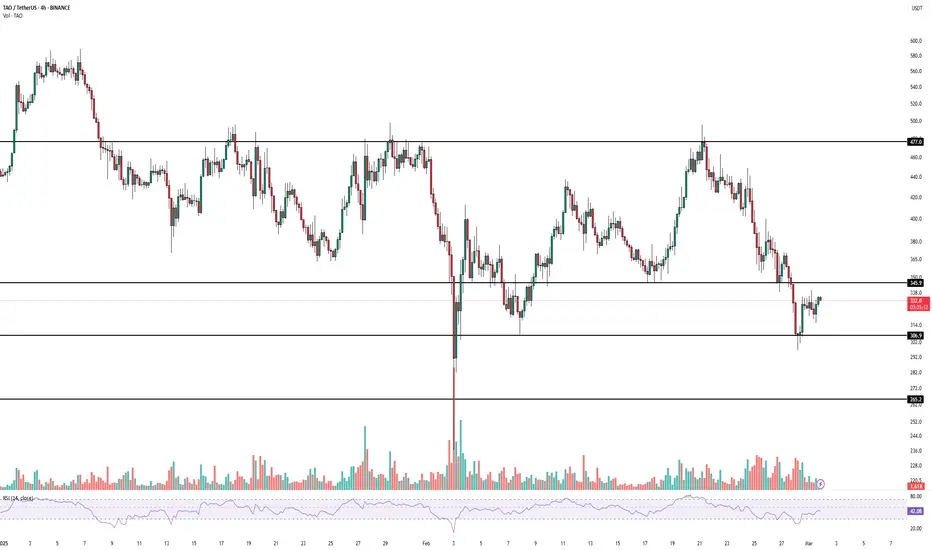
🥸 In the 4-hour timeframe, we are observing a descending range pattern with significant resistance at the area around 477. Every time the price attempts to rise, it gets rejected from this level. Recently, the support at 345.9 was broken, and the price has dropped to a lower level, reaching the support at 306.9.
⭐ The RSI oscillator has exited the oversell zone after completing a bearish leg and has returned to the normal range. The market volume appears to be decreasing, which is common on weekends.
🕯 If the support at 306.9 breaks and the RSI enters the oversell zone again, we could witness the next bearish leg down to the support at 265.2. If the price ranges today and tomorrow while the market volume is low and then breaks this support at the start of the new week, this breakdown would be more credible.
📈 As for long positions or buying, we need to wait until this bearish momentum exits the market and the price establishes a new structure. Therefore, I cannot provide a specific trigger for long positions at the moment.
TAOUSDT trade ideas
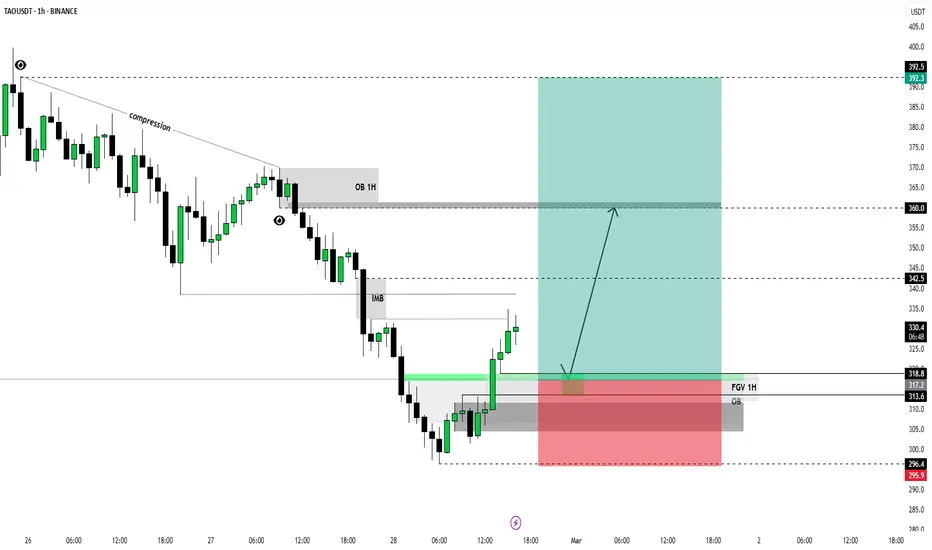
TAOUSDT LONG 1HLocal signs of a price reversal are forming on the TAO coin , which opens up new opportunities for finding good long entry points.
I'm waiting for confirmation of the POI block with the subsequent reaction of purchases. If the variables are positive, I will open a Long position with the following targets:
$342.50
$360.00
$392.30
Risk management - 1% on stop order
#TAOUSDT – Fast Trade, Monitoring Price Action📉 SHORT BYBIT:TAOUSDT.P from $340.00
🛡 Stop Loss: $354.55
⏱ 1H Timeframe
⚡ Trade Plan:
✅ The BYBIT:TAOUSDT.P price is forming a downtrend after breaking a Falling Wedge pattern.
✅ The asset is trading below POC (Point of Control) at $363.85, confirming seller dominance. ✅ After forming a double bottom (Bottom 1 & Bottom 2), the price tested resistance but failed to hold above it.
🎯 TP Targets:
💎 TP 1: $334.00
🔥 TP 2: $328.00
⚡ TP 3: $321.00
📢 This is a fast trade – it's crucial to monitor the coin's behavior and quickly adjust take-profits.
📢 A close below $340.00 would confirm further downside movement.
📢 POC at $363.85 is a key volume area where sellers are in control.
📢 Increasing volume on the drop supports the bearish outlook.
📢 Taking partial profits at TP1 ($334.00) is a smart risk-management strategy.
🚨 BYBIT:TAOUSDT.P remains in a downtrend – monitoring for confirmation and securing profits at TP levels!

TAO has fallen out of the parallel channelTAO has fallen out of the parallel channel. Likely to fall to the yellow zone imo

TAOUSDT READY FOR PUMPTAOUSDT is ready for pump, structure is still bullish and taken previous low liquidity with wick. Expecting a nice pump here.

Price this weekPrice broke below ascending trendline support.
Current price at $358.4, near short-term support.
Potential recovery towards $411.7 if bounce occurs.

Minor ReversalThe technical analysis shows that the Bittensor price might gain around 7% tomorrow and rise to the $384 target.

TAO Outlook after the Dip. What to expect NOW?Because of politics and misleading news, we are now witnessing these prices, and this caused most of my analyses to be wrong and not go according to my thoughts. However, now the price has a strong support area that if it reacts to it, the price will go up to $400 and create a V pattern. Since this market is filled with some politicians and some Persons & their misleading promises, maybe the price will drop again and go down to $310 and then grow again.
Give me some energy !!
✨We spend hours finding potential opportunities and writing useful ideas, we would be happy if you support us.
Best regards CobraVanguard.💚
_ _ _ _ __ _ _ _ _ _ _ _ _ _ _ _ _ _ _ _ _ _ _ _ _ _ _ _ _ _ _ _
✅Thank you, and for more ideas, hit ❤️Like❤️ and 🌟Follow🌟!
❗Disclaimer
⚠️Things can change...
The markets are always changing and even with all these signals, the market changes tend to be strong and fast!!

TAO Ready for CorrectionThe price is in a descending wedge and may drop to $370 to liquidate traders before rising to $480.
Give me some energy !!
✨We spend hours finding potential opportunities and writing useful ideas, we would be happy if you support us.
Best regards CobraVanguard.💚
_ _ _ _ __ _ _ _ _ _ _ _ _ _ _ _ _ _ _ _ _ _ _ _ _ _ _ _ _ _ _ _
✅Thank you, and for more ideas, hit ❤️Like❤️ and 🌟Follow🌟!
⚠️Things can change...
The markets are always changing and even with all these signals, the market changes tend to be strong and fast!!

TAO/USDT Trading IdeaGETTEX:TAO is looking solid. It’s forming almost the exact same pattern as before that led to that juicy rally. Right now, there’s a high probability of a retest at $740 (potential 100% rally), and if we get a clean breakout, we could start exploring new ATH territories. Let’s see if this scenario plays out. Watching closely.

Fake breakout channel up rising price may bi down near 400 dollaKindly coorect if may wrong
4 hour rising channel up pattern price mah be breake 400 or down

$TAO The wedge that no one saw comingIt looks pretty darn strong - as if the market itself is telling us: Get ready for a twofold upward spurt in the coming days. While everyone is panicking or sleeping, there's pure growth math being drawn here.
Horban Brothers.

Looking at CPR 3 step reversal patternLooking at CPR 3 step reversal pattern - Combining this with my PAR indicator RSI based.

#TAO/USDT#TAO
The price is moving in a descending channel on the 1-hour frame and is expected to continue upwards
We have a trend to stabilize above the moving average 100 again
We have a descending trend on the RSI indicator that supports the rise by breaking it upwards
We have a support area at the lower limit of the channel at a price of 418
Entry price 440
First target 452
Second target 472
Third target 490

TAO still bullish or in bear market phase?We have two potential scenarios for TAO:
1.) Bullish Scenario: This is based on the macro degree wave 5, where the 1-2 wave structure has already completed, and we are currently in the process of unfolding the remaining subwaves 3, 4, and 5. If this scenario plays out, we are targeting levels above $1000.
2.) Bearish Scenario: This scenario remains a possibility, as the macro wave 5 may have already terminated, signaling the start of a larger corrective phase. In this case, we would be entering a bear market, with a potential ABC correction unfolding.

Long TAOTAO is bouncing off the support level. A bullish movement is expected to continue and research the resistance level at $588

$TAO Bittensor Tao Ascending Triangle...GETTEX:TAO Bittensor Price action is currently in an ascending Triangle
Current price: $361.5
Superbuy flashing on the SuperAI indicating a shift in Trend on the 45min Timeframe
Neckline resistance is btw 369-386
$CRYPTO:TAO Tao price action break above this neckline resistance can lead to take profit: 431, 474
This Tao idea invalidates below 330

Bittensor’s Meteoric Rise: Can It Hit $550 Next?In a market full of uncertainty, Bittensor (TAO) is defying the odds. While many altcoins struggle to find momentum, TAO has surged 33% this week, drawing attention from traders and investors alike.
It’s not just a short-term spike. Over the past 24 hours alone, Bittensor has gained 15.61%, with a trading volume of $320.47 million fueling the rally. The broader trend is equally impressive—up 18.31% this week and posting a YTD return of 4.17%, proving that bullish sentiment is alive and well.
What’s Driving the TAO Rally?
📊 MACD Signals Strength – The rising green histogram confirms increasing buying pressure.
📈 Golden Cross Incoming? – The 50-day and 200-day EMAs are aligning for a potential breakout.
📌 Key Resistance Ahead – If TAO holds above $500, the next stop could be $547.
What’s Next?
A sustained rally could push TAO into price discovery mode. But if momentum fades, support at $437.50 will be key. A deeper correction could send it toward $326 if sellers take control.
For now, Bittensor remains a standout performer, proving that even in turbulent markets, there’s room for strong breakouts. The question is—will it reach $550 next?

A Cool 3x On Bittensor $TAOAI is still hot and so is Bittensor TAO as one of the biggest winners since 2023.
Also – as of now – the Inauguration seems to trigger a little Mania.
Thats why I think this Cup and Handle Pattern will play out soonish.

Bittensor: Solid Trading, High Profits —Strong Bullish Signals This is a great pair and the chart looks awesome. There is a combination of simple signals, classic signals and strong signals; all bullish signals.
Let's get started.
Bittensor (TAOUSDT) recently produced very high volume. The session with the highest volume was a green day. This volume started rising in November 2024.
There was a major low hit on the 3rd of February 2025. This major low is a higher low compared to 5-August 2024. Boom, that's a classic. A long-term higher low (six months).
To continue with the classics, today TAOUSDT is moving above EMA55. The day is early so this is a strong signal. This is quite revealing. Once above EMA55 the bullish bias mid-term is confirmed; but, to be honest, we are going up long-term.
If you move the chart up, you can find higher targets. The first target on the chart is something minimum and easy. This pair can also be traded with leverage just as one can accumulate through spot. The choice is yours.
This is a major pair and will do great in this bull-market.
There are many different types of pairs. Some have high potential for profits but there is some uncertainty around them, small pairs. Some others are very strong and easy to hold. This one is in the category of easy hold. If you have a big diversified portfolio, I recommend this one. I think it will grow really strong.
The market offers something for everybody, all types of traders, for all types of lifestyles, for all types of capital.
My people are mainly searching for stress free, relaxation, sure long-term profits, but we also have leveraged traders and also some memecoiners, there is everything for sure.
What you choose is up to you.
It will depend on your likings. Your risk tolerance, your capital, what is available in your country, your goals.
I am here always for your assistance.
I am at your service.
Thanks a lot for your continued support.
You will do great in this bull-market.
I know you will.
There is no other option. What you get is the result of your work.
You've been working hard.
You deserve the best.
Namaste.

TAOTAO slightly broke the downtrend today and it is accumulating volume, next 3-4 days i see it to create a price support and push up to 450-480 and if this price is reached then we could see 540-550$
Hope market will be positive and we see some gains for ALTS.
NFA
DYOA

TAO (Bittensor); my notes for long-termIf it breaks the falling wedge by rising, it promises hope. Buying zones are 270 - 310 - 360. Above, 570 - 700 and 830 are important profit-taking levels. I am following the levels I marked on the chart and this formation. for negative scenario, i keep in mind that levels: 150 - 180.
This is not investment advice.

$TAO - Bearish Retest TAO is still holding $350 as support.
If Bitcoin can maintain 94k, we could see TAO retesting the $487 to $520 range.
From there, we will have to determine whether this is merely a bearish retest or not. It should flip $400 to confirm.
