GF101! trade ideas

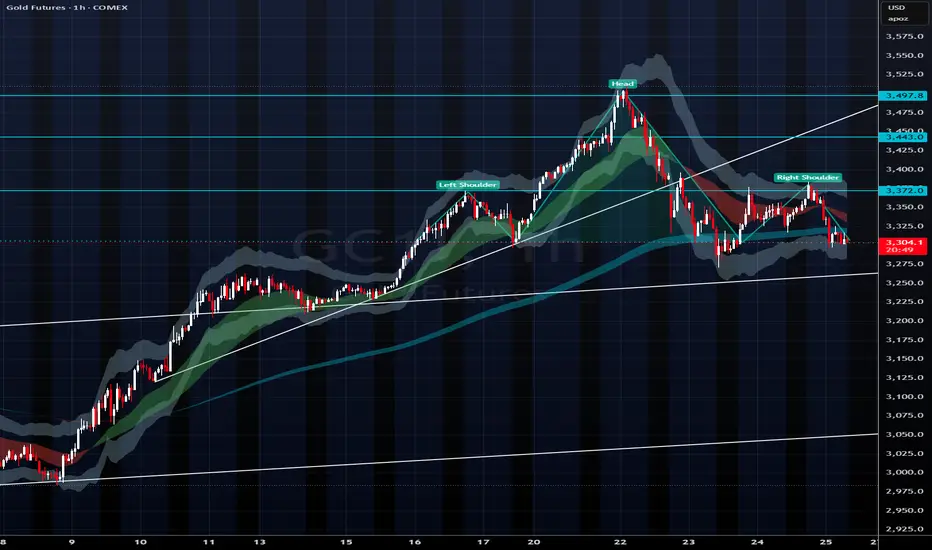
Watch to Watch - Gold Bearish Head and ShouldersWith the recent strength in US equities, the long gold trade may be over. Gold broke below a key trendline and formed a distinct bearish head and shoulder pattern signifying possible downside pressure coming up today and into the next week. Definitely worth watching for futures traders. First target with a break lower would be around $3240 with a lot of downside from there.
Long trade
1Hr TF overview
Trade Overview: GC1! (Gold Futures) – Long Position
Entry Price: 3395.9
Profit Target: 3469.0 (+2.21%)
Stop Loss: 3311.4 (–0.33%)
Risk-Reward Ratio (RR): 6.68
🕕 Entry Time: 6:00 PM
📅 Date: Wednesday, 23rd April 2025
🌍 Session: New York PM
⏱ Entry Timeframe: 5-Minute TF
Reasoning Narrative
GC1! displayed signs of bullish continuation going into the New York PM session, with price consolidating between 3.325 - 3,319 in a tight range above a recently reclaimed support zone, followed by the breakout.

GC (gold) UpdateSo I managed to dump my GLD holdings Tues premarket (left a comment on one of my posts Tuesday morning) because I realized that gold was doing a three drive pattern, got a pump at the end which started to sell off premarket. Not to mention, it had hit the target I posted with the big green arrow.
Also, we have confirmation that my 3 hr indicator does work on GC, it bounced when MFI hit my red line. Did not play it, and it's a pretty weak bounce. GC isn't behaving the same as it did on its way up, I think there are bagholders that bought on the way down that are selling now on the way up. Every pump pump just gets sold off, there were some pumpers afterhours today, but that pump sold off and looks to me like it wants to go red tonight.
Going to wait until I see a big move before I play this again. I think the only reason why it's a little green tonight is because they're pumping commodities, and gold is a commodity. The Euros might sell it off though, seems like they are always the sellers, guessing the gold algos are mainly run by them.
I don't plan on shorting but if you do, the time to do it is when MFI hits overbought.

Gold will continue to break out!Looking for the bullish price action to continue as we get ready to close the week and next week close the month. Watching for support as we move into the killzones. Excess has been created on the DOM and it should continue from here.


Now that we Have our Pullback...Back to BULLISHNESSBeen waiting on this pull back. Now that we got it price should move more reasonably. Looking for the bullish action to continue and new highs to be made.

Gold Is Surging , Remains in Bullish Uptrend### **1. Overall Trend**
- **Trend Direction:** Strong **uptrend** from early October 2024 to April 2025.
- **Price Action:** Gold surged from around $2,800 to over $3,300, hitting a high near $3,329.
---
### **2. Indicators & Strategy Setup**
**Strategy Used:** Steve’s DC-MACD Strategy (Manual Settings)
- **DC Length:** 20
- **MACD Fast:** 12
- **MACD Slow:** 26
- **Signal Smoothing:** 9
- **Moving Averages Type:** EMA
**Overlay Elements:**
- **Green/Red Channels:** These represent **Donchian Channels** or volatility-based bands, indicating consolidation vs breakout.
- **White Line:** Possibly a shorter EMA used as a dynamic support/resistance guide.
---
### **3. Signal Arrows**
- **Red Down Arrows (BEAR):** Sell signals, typically at local tops or when the MACD crosses down.
- **Green Up Arrows (BULL):** Buy signals, often following a breakout from consolidation.
Recent Signal:
- **Latest signal is BULL** in early April, aligning with a breakout above $3,100.
---
### **4. Volume**
- **Spikes in volume** around signal points suggest institutional participation.
- Noticeable volume increases in:
- October (2024)
- January and April (2025)
---
### **5. Market Context**
- **Current Price:** $3,324.5
- **Pullback Potential:** After hitting $3,329, a short-term correction is possible, but the trend remains bullish unless price breaks below $3,200 with heavy sell volume.
---
### **6. Strategy Effectiveness**
- The strategy has **accurately captured several trends**, especially the bullish breakout in late March.
- However, **multiple false bear signals** during the uptrend suggest better performance in trending markets than in sideways conditions.

Gold Futures – Short-Term Technical Outlook as of April 23Gold surged to nearly $3,500, but multiple indicators now point to a potential top. A short-term correction or consolidation phase appears likely before any new highs.
Bearish Signals Across the Board:
RSI Divergence: RSI failed to confirm recent highs, showing bearish divergence.
Momentum Fading: MACD & momentum oscillators rolled over → rally exhaustion.
Volume Shift: Rising on down moves, drying up on rallies → classic distribution.
Bearish Candlesticks: Spinning tops + bearish engulfing patterns signal reversal risk.
Elliott Wave: Likely completed 5-wave impulse → next up: ABC correction?
Cycles: April top aligns with intermediate cycle peak → watch May for cycle low.
Seasonality: Historically weak May–June period approaching.
COT Data: Speculators still long, but commercials heavily short → caution warranted.
🎯 Trade Setups
Short-Term (1–5 Days)
🎯 Short Entry: ~$3,400
📉 Target: $3,270 → $3,215
🛑 Stop: Above $3,460
Medium-Term (1–4 Weeks)
📉 Short below $3,215 → Target $2,970
✅ Or go long on confirmed bounce at $3,150–$3,180
Long-Term (1–6 Months)
🟢 Bullish bias after correction completes
🛒 Buy zones: $2,960–$2,720
🎯 Targets: $3,540 → $3,900+
⛔ Stop: Below $2,700
🧭 Outlook Summary:
Bias: Cautiously Bearish (short-term) → Bullish (long-term)
Gold likely topped in April — expect weakness or sideways action before the next major leg higher. Be patient for a better buying opportunity later this spring/summer.

Remember DEATH CROSS ? 50----200 upside down on a daily chart is a complete death cross for a price we are on 15MTF only but still bearish on it-- heavy selling volume each hour, we can pick some for our holiday season pocket.... Good Luck Bears

Gold correctionPrice movement started upward from blue arrow mark. It can tesr mercilessly test black line drawn level.

The Gold Rush is overA rejection off of 3508 level with an evening star or shooting star (depending on how you view candlestick patterns) and a close below other key Fibonacci and sup/res levels will likely cause a downtrend in the foreseeable future. Any closes below key levels should be viewed as bearish price action.

Sell zone worked now the price will go to buy zone Sell zone worked now the price will go to buy zone. Then new highs again. Not trading advise.

200 SMA pie for Bears SMA is a bold indicator to know analyze the price run & reccent prices was up by 21% & gap up opening in few trading sessions--makes a great bear move to catch let's understand.
___________________________________________________________________________________
1) Gold is a commodity.
2) Which oftely don't show the big price moves.
3) 4 gap up opening in last 15 sessions.
4) Unusual volumes and move of the price.
5) Geoplitical Tensions of US-Tarrifs making gold the most attractive investment.
6) 20.65% up from 200SMA.
___________________________________________________________________________________
Less favroble for buyers and with good money for bears to make, unless some investment bank put in a 1/2 Billion.... GoMakeIt

asymmetric triangle or Rising wedge ? This chart shows the potential formation of either a symmetrical triangle or an ascending wedge on MGC1! ( Micro Gold Futures). The distinction -- Both suggest consolidation, but the edge leans bearish while the triangle is more neutral until broken.
I identified the prior impulse move downward as the dominate leg. Price is currently forming higher lows, but may fail to break past the highs with strength, suggesting potential exhaustion from the bulls.
I'm watching for:
*A possible false breakout, then breakdown continuation.
*The wedge's lower support to be tested.
* Confirmation via a clean hourly close or with a bearish engulfing below $3,371.0
My ideal entry would be at the 50% FVG pull back of the engulfing candle.
My First TP would be $3303 then my extended would be $3260, stop-loss above $3,380.
Reasoning: this idea combines FVG imbalance, 50% institutional discount levels, and price action structure. The pattern also hints at market indecision, so I remain reactive rather than predictive. The market isn't worth it just tells a story and I'm listening to the chapter before the breakout.

Gold 97350 trend finally caughtWe are happy we could get the trend of gold finally. As we had posted yesterday though gold moved higher to 99358 intraday lost its gain 2000 and finally closed below the resistance 98582 we had mentioned.
Today we expect Gold close would be below 98073 and more possibility to get corrected to test the imbalance at 90910.
------------------------------------------------------------------------------------------------------------------
yesterday we posted in
Our analysis about gold was going wrong and wrong again and it is moving higher and higher.
After careful study and applying *new TA concepts * we have come to a conclusion it would be 98582 which would be its climax resistance on close basis and would get corrected.

Mid-Week Market Forecast: GOLD, SILVER, COPPER & PLATINUMIn this video, we'll present analysis and best setups for Wednesday, April 22nd to the end of the week.
Gold is still a buy.
Silver may present a sell opportunity at current levels.
Copper looks like it is setting up for a valid sell.
Platinum has showed weakness early this week. We'll watch for continuation.
Be patient, and wait for confirmations!
Enjoy!
May profits be upon you.
Leave any questions or comments in the comment section.
I appreciate any feedback from my viewers!
Like and/or subscribe if you want more accurate analysis.
Thank you so much!
Disclaimer:
I do not provide personal investment advice and I am not a qualified licensed investment advisor.
All information found here, including any ideas, opinions, views, predictions, forecasts, commentaries, suggestions, expressed or implied herein, are for informational, entertainment or educational purposes only and should not be construed as personal investment advice. While the information provided is believed to be accurate, it may include errors or inaccuracies.
I will not and cannot be held liable for any actions you take as a result of anything you read here.
Conduct your own due diligence, or consult a licensed financial advisor or broker before making any and all investment decisions. Any investments, trades, speculations, or decisions made on the basis of any information found on this channel, expressed or implied herein, are committed at your own risk, financial or otherwise.

Gold chart showing interesting dataInteresting chart on GOLD futures.
Always wise to WAIT until end of day/week.
Daily Chart
Heavy selling has not meant much BUT the movement today is....... different.
Weekly Chart
RSI is not bad but it is weaker than Oct 24.
$ Flow is down a significant amount compared to last top.

GL Long on 3rd bullflagMy GL trade thesis. Previous two potential bullflags had a strong confirmation when first 15 min candle closed abolve VWAP. A 3rd Bullflag might be forming. Looking to go long on the 1st closed green candle on 15min today. With a stop at 3450. Profit target, 3550 (psychological level).

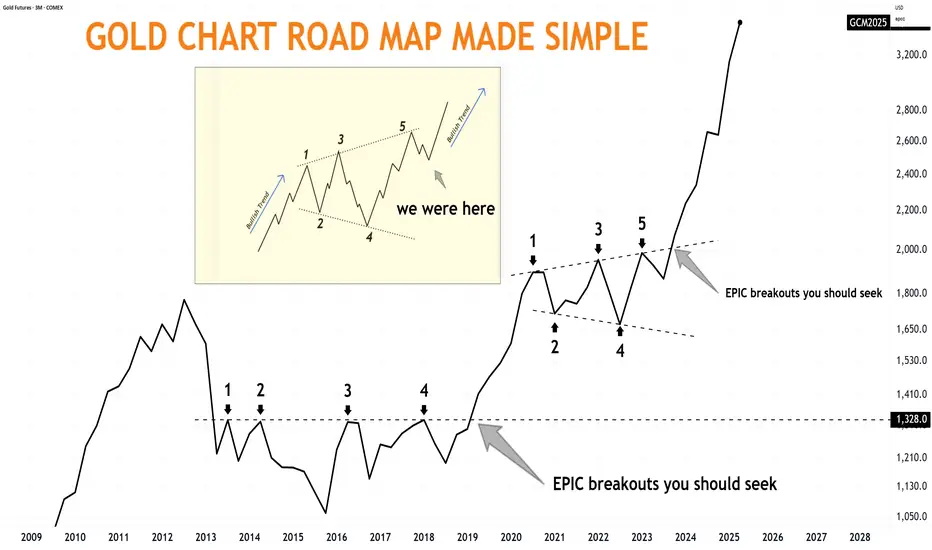
Gold is up over $1500Since I did this post back in August 2023.
Gold is up over $1500 in less than 2 years.
EPIC breakouts you should seek
Long trade
15min TF overview
Trade Overview: GC1! (Gold Futures) Long Position
Entry Price: 3468.9
Profit Target: 3509.6 (+1.17%)
Stop Loss: 3462.2 (–0.19%)
Risk-Reward Ratio: 6.07
Target Liquidity High: 3509.8
🕔 Entry Time: 5:05 AM
📅 Date: Tuesday, 22nd April 2025
🌍 Session: London AM
⏱ Entry Timeframe: 5-Minute TF
Trade Reasoning
Intraday Market Structure:
The 5-minute timeframe revealed a bullish internal break of structure, signalling a short-term reversal and favouring buy-side continuation. Price had formed a higher low, respecting bullish structure and suggesting accumulation.


GC UpdateNot sure if this is a melt up or not, bit strange that RSI and MFI are moving in opposite directions.
I have a long term position set up, but I'm not planning on doing big options plays unless MFI hits the red line or if I expect the stock market to drop. I might play a little tomorrow for TSLA earnings, lol. (TSLA has dropped so much it's only 2.6% of QQQ, it won't be able to tank the market on its own.)
I think the next big gold movement happens when the China electronics tariff is announced. No idea when that happens. The market is just a guessing game with Orange Man in charge.
In any case, I have a EUROTLX:4K target for gold, don't really care if I have to wait a few months or a year or whatever. This seems like a safer bet than anything else.
