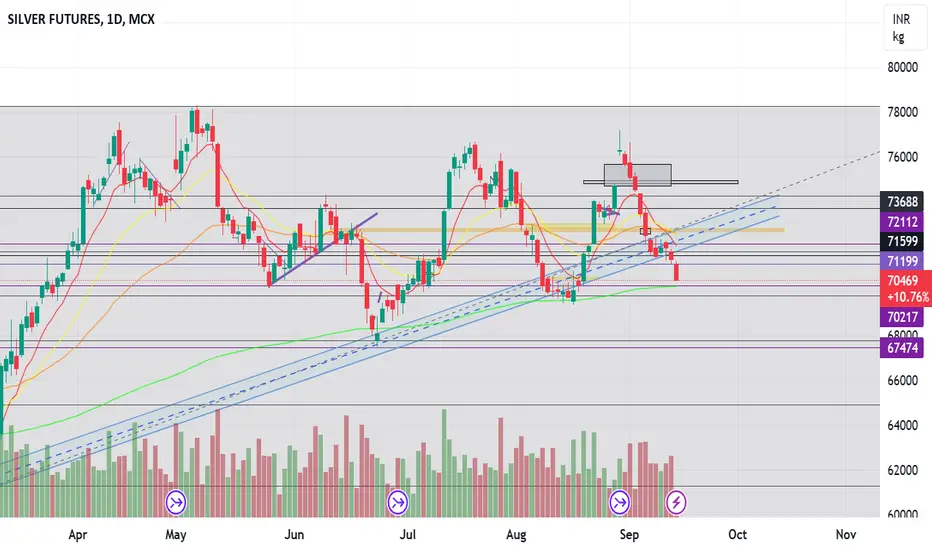
Again Silver will go higher accumulate at this level On Our Harmonic pattern indicator based trade setup take trade as explained below :-
Early trades Buy or sell below/ above 23.6 %, safe trades buy or sell above / below 41% , after taking trade next upside or downside levels will be target ,
When reverse buy or sell signal appear then book profit on Target or trail SL to 23.6 % If trailing SL hit then early trade can be taken above or below 23.6 and safe trade can b taken above/ below 41% ..
Please note:-
It's working on news based and volitile market very well so exit if SL hit
SVF1! trade ideas

Five Wave Up? After Three Waves Corrective!Greetings, dear friends. I hope you are having a productive week.
I want to share my market analysis ideas based on the Elliott Wave Principle with you.
I am a fan of this principle and follow all the rules and guidelines for analyzing the market.
However, please note that my ideas are based on my personal experience and may change over time.
If there is an error in my analysis, I am open to re-analyzing it from the beginning and learning from my mistakes.
It's important to understand that making an error in analysis is not a fault, but evading responsibility is.
No one can analyze financial markets with 100% accuracy, but it's remarkable how close we can get.
We analyze from multiple perspectives to consider all possibilities.
Let's mention a few opinions and ideas!
Based on mathematics.
I am still practicing to understand the Elliott Wave Principle better and hope to provide an even better analysis in the future.
Thank you for your continued support, and I look forward to our mutual success.
Best regards,
Mr. Nobody
Keep trying and never give up.
Good luck!

Be careful about fighting price action10 16.23 8 am I have been spending a lot of time looking at gaps and the failure of markets to read test gaps. I looked at three markets that could be problematic if you're not careful and you decide to take a trade today: Oil Silver And gold. I look for markets to retest breakouts which are a great way to enter a market when they correct lower. When markets reach a high point on a swing going in one direction.... I look to be a seller... although this is a little more challenging strategy that I talk about all the time. There were opening price trades to go Short in oil, Silver, and gold.... And I think this is a mistake. And these markets could go lower.. but I don't think the market shows that and I don't think it's worth the risk... so I'd rather just lose the opportunity then take the risk.

Silver current situationSilver after getting lifted by geopolitical tension, arose to 72000,now if it release some air, it might go below here. Keep watching cautiously for any new outcome.

DeGRAM | Silver short from kill zoneSilver is approaching the resistance level and the 50% fibo level.
The market is in a bearish trend; it's making lower lows. Price dropped from this level.
We anticipate a short-term trade from the kill zone.
-------------------
Share your opinion in the comments and support the idea with a like. Thanks for your support!

Silver to 21.650$Silver is going to test 21.650$ level by the end of the week.
Follow To Get More Signals

#Silverm making bat pattern#silverm is making harmonics bat pattern
The pattern will be confirmed perfectly only after touching 69525
If the prices breaks 70000 , pattern will be failed and cannot make any position
Also the silverm breakdown the trend as shown in the chart
If its makes perfect
The entry will be @ 69525
Sl @ 69370
Target @ 69790
# educational purposes only

Silver: Converting resistance to supportSilver's next hurdle is the 24-25$ area.
But after that, a run on the famed 28$ "wall" should be expected.
Now, that will be a breakout for the ages!
#silver #gold #inflation #recession #recovery

Silver part 210.9.23 This is part two of silver. you should listen to part one first because I couldn't make a trade decision in part 1 and I needed to wait for the next 4-Hour bar which would occur in 30 minutes. I explained why this is important and it essentially amounts to needing one bar to close and no that in this case Not only did that bar trade below the support but it even closed above its low and the current bar in a very short. Of time shows you a two-bar reversal that the market should go higher..... but I needed the first bar on the first video to close. And I had an idea that probably I would find my trade on the next 4 hour bar... but I wasn't 100% certain it would go higher.... relative to Friday that had a fabulous range... today it's a less volatile market and less directional... so I would never be as certain with this overall pattern as I would be in a market that's way oversold or overbought..... this is more pattern like Behavior and there's a battle at a 382 in a market that really isn't that bullish or bearish. Sometimes you have to wait for the market to do something...Before you see the Probability that the market will do something in the direction that you're looking for. Within a very short time after the open of the next bar the market moved up about $950. if you're careful you can scalp markets like this. that may or may not work for you..... on the other hand if you look at markets like this you might make decisions to not take a trade and that keeps you from making a bad trade decision. when the market opened and started going higher after the previous video I knew that if I took a long trade that I could use the support area as my stop when I didn't know that on the previous bar...

Silver10.9.23 9:30 am The silver gapped open on its opening price and then it eventually went lower by 382 which formed a potential support. the concern as a buyer Is that the market is not quite showing you a two-bar reversal higher... but it's close. In addition it doesn't take much for the market to show you a two-bar reversal that suggests that the market is going to break below the 382 and be a short trade. In the meantime the markets really not going anywhere at this time. and it's basically showing small bars retesting miter gaps higher and lower. What makes the long trade more attractive is that there was a very nice swing from the support on Friday and the market gaps a little bit higher on the open with a minor 382 correction and if this 382 holds we can see this market go significantly higher. On the other hand It doesn't take much for the market to have a two-bar reversal going lower and there's not a lot of supporting structure so the market could go significantly lower. It's a tough trade to take here... I'm guessing that the next 30 or so minutes will bring some clarity and possibly a trade decision. The video was an explanation of how I would use the terms Gaps and retest of gaps. It doesn't take me 8 minutes to do a video to see the gaps... I just have to spend a moment or two to look at what the market's doing... and I see gap retests With the market did for the moment has very shallow range. If I don't do this kind of thinking it is my belief that I'm going to still have a point of view and it may be more influenced by the impulse to want to take a trade because time is money and no trade means no money and I am a recovering impulse trader with bad trade decisions and a painful record of stops.

5 Steps:The Silver Contract All COMEX Is Talking About#1-The Silver Way To Profit
Silver price has shown a spike today on Monday as i woke up to check out the chart in the morning.
#2-There's Big Money In Silver
Silver is a good opportunity for you especially if you are trying to learn about trading without taking much risk.
#3-Turn Your Silver Into A Money Making Machine
The good thing about buying physical silver is that you don't need margin to hold your position in it.
#4-Want To Be A Silver Bug?
Again being a silver bug is very simple - right now the bear market is very terrible and the panic that is in the markets is evidence as to why many investors are seeking a safe heaven asset.
#5-Hidden Silver In Your Portfolio
This is the most secure investment you can hold for yourself and your loved ones, a future inheritance
Disclaimer:This is not financial advice do your own research before you trade

DeGRAM | SILVER longSilver price went down and tested a major support zone.
Price action is likely to consolidate at that level.
The market reached the demand zone, where the price made a sharp bullish move.
Price action created an engulfing candle at the support level, an indication of potential upward momentum.
-------------------
Share your opinion in the comments and support the idea with like. Thanks for your support!

Silver ready for upside move On Our Harmonic pattern indicator based trade setup take trade as explained below :-
Early trades Buy or sell below/ above 23.6 %, safe trades buy or sell above / below 41% , after taking trade next upside or downside levels will be target ,
When reverse buy or sell signal appear then book profit on Target or trail SL to 23.6 % If trailing SL hit then early trade can be taken above or below 23.6 and safe trade can b taken above/ below 41% ..
Please note:-
It's working on news based and volitile market very well so exit if SL hit

Sell silverNote the levels #silver
Sell silver at the level
According to my analysis silver to be sell as per my chatings

SILVER Silver clearly showing downtrend further support may be looked at 69700 @ 200EMA:<If it contiounsly fall down , we could expect retreat at 67700 @ 0.61 FIB.
BEST BUYING LEVELS FOR SILVER IS 64000 TO 65000. TARGET - 79000 TO 82000
Monthly Silver chart might bounce off of trend lineSilver has sold off aggressively the last few days. You can see that the price is now right near an ascending trend line. If this trend line holds, then we can expect a bouce upward soon.
The trend line is not quite touched. Maybe price will drop a further 50 cents or dollar to touch it?

Silver Monthly Candle Forms a Pinbar (Hammer)August's silver monthly candle completed as a pinbar. This "hammer" gets triggered as a buy signal only if the price moves ABOVE the top of the pinbar by a few cents, or around 25.50 for the December contract. Some traders may buy early by going to the lower time frames of daily or 4 hours and looking for a buy entry midpoint between the close and the bottom which would be around 23.60. (Still, the trade is only considered a buy if the price hits around 25.50!)
Please see my previous idea about what I think is an inverted head and shoulders on the silver weekly chart. A weekly close above around $26 could send silver to $34 or higher.
Sometimes silver does lead gold, so if this trade is triggered expect gold to head higher also even if it is lagging at the time.

Silver bottom, Gold too most likelySilver seems to be bottoming on daily chart. You have a pinbar candle, a way oversold RSI. A reasonable up day/green candle close should be a buy signal in my book.

Managing a silver trade if it moves lowerOctober 4th 2003 10:40 am. It looks like silver is going to make a new low after we found a bullish reversal yesterday. I don't mind a little bit of risk but I go out of my way to avoid large stops... so this is how I would manage a trade based on that. It does require looking at price action and retest of gaps or failure to retest gaps to help me make trade decisions.

Silver had a reversal today should be going higherOctober 3rd 2023 Yesterday I put a target area for where silver would stop going lower and start moving higher. It did that earlier this morning and what I mean by that is the market opens up around 6:00 pm I believe after the session break and sometime last night it went lower and then it reversed. Now it's only up a little bit and I think that it will continue going higher but there's always a chance that we could have a bear Flag and makes a new low... but we have a Contingency plan if that happens. I wanted to spend time on the importance of an ABCD pattern to help me find a reversal.... and I wanted to spend some time looking at expanding markets.... thinking that many traders don't know what that is so they can't react what they can't see.... so I wanted to articulate it from my point of view.
ABCD patterns
Expanding markets

Is this a buying opportunity in silver?October 2nd 23: In this video we see the market lower than it was last night. I changed some of the chart in a little bit because I didn't like one of the ABCD patterns... so I explained that. I changed the range boxes a little bit.... when the market went a little bit lower I visualized it a little differently.... so I changed that. The market went lower and on a smaller than usual time frame... the 2-hour chart, I could see that there was a 1.618 extension that was touched reversal pattern....And then I went into rant About small stops.Markets like this can produce two or three bear flags meaning that the market finds buyers but it quickly makes a new low. the bear flag is an indicator to me that I have the right idea because the market did go higher but I was just a little bit too soon and the market made a new low... and sometimes I might hesitate or even wait on a trade and avoid the bear flag that makes a new low.... but sometimes that trade didn't make a new low and then I'm glad I took the trade. My thinking when the markets are like this is that I think the market is going higher but it's not quite at that support area or that extension that I'm looking at And if I don't take the trade I'll miss the reversal. sometimes it pays to take the trade even though there's a better trade location below The current price.The way this market looks on this video is that it could go higher from this point but it wouldn't surprise me if it gets down to that support area or to the Measured move. I do believe however that the market is in the ballpark for a reversal and I know for a fact I will not have a large stop. In this case I'll be buying physical depending on the price I get from my broker. The other reason for metals to go down could be because the general market is very weak and professional funds have to liquidate a lot of their positions because they're overextended and that means they may have to close Gold or silver positions.... and some firms sell the paper and you can't see them buying the physical.

Silver Daily "Demand" LONGVery incomplete analysis here, but looking for confirmation of reversal on low timeframe charts. Additional zone lower, so keep that in mind, but these levels haven't been seen in quite some time and there was an imbalance favoring buyers last time we were here, so consider a buy despite very negative headlines, recent USD strength, etc. Stepping in front of momentum, though, so use good judgement re: sizing. Also may want to consider mechanical profit scaling @ 1:1 + holding runners. Will revisit/update later.
JHart @ LionHart Trading

Silver near to bearish zone if breaks 0.50 Fib level & TrendlineSilver has touched trendline of 1 day TF and broke trendline of 1hr TF. If it breaks further we can expect a big fall in Silver. Reason is break of trendline and 0.50 Fib level which are important levels.
Be cautious in trading silver and lets wait for the next move of Silver to decide the trend.
Follow me to get further updates on what should be the next step. Your thoughts are welcome.
