USDTBH DAILY POSSIBLE OUTLOOKUSDTBH AS SOON BREAK THE SUPPORT TRENDLINE WILL MAKE A BOUNCE ON MAJOR SUPPORT AREA FOR BUYING OPPORTUNITY.
THBUSD trade ideas

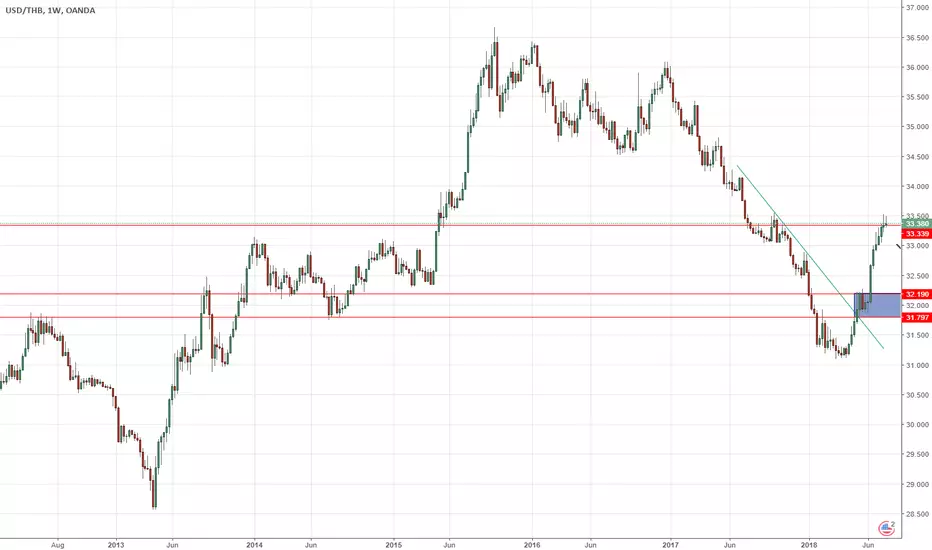
USDTHB = A new rally brewingTHB has been THE strongest currency in Asia this year, Thai government has been trying to keep currency stabilize in very controlled envelop, but what needs to come, still needs to come.

Ascending triangle pattern in USD/THB chartExample of an ascending triangle, following the uptrend. Trend lines conforming the triangle are touched by the chart in at least two points. Please note the increase in volume at breakout (red arrow).


USDTHBWhats up Traders.
Primed like a pump.
Golden Ratio Retracement
Spread has come down quite a bit from open. I think its time to long this one.


Can Anyone Help Me???If you have experience with Elliott Wave Theory I would really love your insight and feedback. Does this look right? I ran Fib Retracement and then Fib Extention. Is this a good projection or should I go back further and start over with a new count?

USD/THB 1H Chart: Bearish momentumThe US Dollar has been depreciating against the Thai Baht in a short-term descending channel after the exchange rate reversed from the upper boundary of a long-term descending channel at 33.05.
As apparent on the chart, the currency pair has breached the support level formed by a combination of the 100– and 200-period SMAs (4H). Given this fact, it is likely that the downside momentum still prevails in the nearest time. The most probable downside target during the following trading sessions is the Fibonacci 50.00% retracement at 32.31.
In the unlikely event that some bullish pressure still prevails in the market, the US Dollar should not exceed the Fibonacci 23.60% retracement at 32.94.

USDTHB = Up onlyCome on, for a country that lives off tourist and foreigner investment, THB is stronger than JPY and CHF against USD?????? This is a no brainner, up it is, targer 33.8-34.2 to be inline with the rest of the world.

Target hit. Now reversing on a Channel Down. Short.TP = 33.600 hit as the previous 1D Channel Up aggressively broke to the upside (as indicated by the 4H consolidation mentioned on the previous post) and peaked at 34.650. Now a new 1D Channel Down has emerged (RSI = 30.614, MACD = -0.139, Highs/Lows = -0.2244, B/BP = -0.4740) aiming at a Lower Low near the 31.850 support. We are short with TP = 32.000.

USD/THB 1H Chart: Potential reversalThe Thai Baht has been appreciating against the US Dollar since the end of August. This movement is bounded by a descending channel.
Currently, the currency pair is trading near the lower channel line at 32.43. From the theoretical point of view, the pair could reverse from the lower boundary of given channel and aim for the resistance cluster formed by a combination of the 55-, 100– and 200-hour SMAs in the 32.60/32.73 range. An important resistance level to look out for is the Fibonacci 38.20% retracement at 32.59.
Technical indicators for the 1W time-frame also support bullish scenario.

USDTHB Dailysell limit;
tp1=33.0000 RR=1;
tp2=32.7500 RR=2;
notice:
1:Risk free after tp1;
2:all lines and orders have a few tolerance!!;

Bearish Engulfing confirm USD/THB Daily Chart go down.USD/THB confirm break down after price below 33.18 and you can increase follow short again if price break down 32.58

USD/THB 1H Chart: Reveal of dominant patternThe previous review of the USD/THB currency exchange rate concentrated on the newly formed less steep bullish pattern. On Tuesday, the pattern was still in force, as the currency exchange rate was declining in the borders of it.
However, something else attracted the attention of Dukascopy Analytics. Namely, a long term, large scale channel up pattern was spotted on the larger time frame charts. It might be possible that in the near future the bounce off from this trend line forces the rate lower and gives it enough strength to break the medium scale ascending pattern.
However, in the short term watch the support of the 55-hour simple moving average, which clearly provided support on Tuesday.


BUY LIMIT AT STRONG DEPARTURE DZ AFTER BROKE TRENDLINE
BUY LIMIT AT STRONG DEPARTURE DZ AFTER BROKE TRENDLINE

Consolidation before Channel Up continuation. Long.USDTHB should enter a consolidation phase on 4H (as seen on the Rectangle with high volatility, ATR = 0.0861) in order to bring down the overbought values on the most recent bullish run on the 1D Channel Up (RSI = 72.893, Williams = -12.000). The suggested course of action is to buy on every dip within the Rectangle, TP = 33.600.


Possible sell opportunity coming up on USDTHBIf the price drops a sell signal (bearish reversal candle) at the upcoming resistance level then expect prices to go down


USDTHB. Triangular consolidation is possible.This pair broke above the long term resistance (yellow) last month.
EM currencies suffer a lot these days amid strong dollar and rising yields.
USDTHB could finish triangular consolidation soon.
The target for the further rise of USDTHB is set within the orange box at the 0.382-0.618 Fibonacci.
Wait if price could break above the triangle's upside.

