$THETA Bull Market ScenarioTheta is about to breakout from this high time frame falling wedge.
The targets I plotted are for mid term holds and if we are back in a bull market.
I still have no confirmation if BTC is entering the bull market so better just DCA since this level is a nice discount zone for those who want to hold this coin.
THETAUSDT trade ideas

THETAUSDT POTENTIAL LONGEntry : 1.045 - 1.035
Stoploss : 1.028
Take Profit 1 : 1.089
Take Profit 2 : 1.120
TRADE WITH YOUR OWN RISK!!!

Theta usdt
🔅 ENTRY : - 1.05$ to 1$
📌 Target 1: 1.15$
📌 Target 2: 1.28$
📌 Target 3: 1.48$
📌 Target 4: 1.64$
📌 Target 5: 2$
📌 Target 6: 2.40$
⭕️ STOP : .945$
Our Public Community

THETAUSDTLong Here after Confirmation
Expecting a good Move on THETAUSDT
Never a Fin Adv
Comment ur reviews if u r free...

THETA/USDTTHETA/USDT
It is in a corrective descending channel.
If it can maintain the level of one dollar, the possibility of growth of this currency is not out of mind.
#THETAUSDT #THETA #BTCUSDT #BTC #ETHUSDT #DOGE #DOGEUSDT


Theta 1.12 Huge ReistanceIf we can bounce back above yesterdays highs, we should break this downtrend. Whales buying this or what VRA is not stable


THETAUSDT | WATCHOUT LEVELTHETAUSDT has been trading in bearish parallel channel. The price has been trading near upper boundary of channel.
The bulls need to break above the channel and mentioned fib level too.
Manage your trades accordingly.

ThetaUsdt Navarro 200 Harmonic Pattern 4H ??🔎 Found HARMONIC Pattern 🔍
Navarro200
-Scalping 🎧 #THETA - Scalping Excellent Long Buy area - #THETAUSDT - quick trade

THETAUSDTTHETA/USDT on both the daily and the 15 min, there is a brutal oversold with RSI below the neutrality level. In the diary, a triangle was formed where Theta is already in the narrowest part, graphically indicating an upward rupture. The volume of this pair is very high and Theta is a high-octane coin as it will be the first blockchain to run 4k streaming. Impulsive kick in sight!

THETAUSDT:D1📢 Please follow your strategy, , this is just my idea
.🙌Please do not forget the ' like' button & Share it with your friends
.✍ I will be glad to see your ideas in this post
.🧲Follow me to see more analysis

For further investigationThe end of the fall and hitting the bottom of the channel and flying again, the potential of at least 50% profit. Enter after the bullish candle closes.

THETAUSDT 4HProjecting a trend-based Fibo retracement we have a resistance at $1,303 which is confirmed with MM200 and then $1,378. We are in an overbought region and can visit the $1,048 level, making a triple bottom (We made a double double bottom on July 13, 2022 and September 7, 2022.) before going for the respective resistances. if the LTB (downtrend line).
THETA is undervalued, out of its fair price. Theta is a native blockchain with an open source protocol, which means it allows developers and partners to build decentralized applications on the network, like Ethereum does.
It is a decentralized peer-to-peer video delivery network powered by blockchain technology that enables free delivery of high-bandwidth content. As users watch videos, some of their computing power is leveraged to relay those videos to other users, with top users earning tokens as a reward.

THETAUSDT | BREAKOUT AND RETESTEDTHETAUSDT has given breakout from triangle. The price has retested the breakout zone and currently trading at support zone.
The bulls are in control.
Trade your levels accordingly.

Theta/USDT Short📉Thetausdt short breakout
All conditions for short confirmed
Take profit is dynamic/trailing stop loss
P.S.THIS IS NOT A FINANCIAL ADVICE

THETA/usd Range Long IdeaTHETA has been in range since May, if we trade a range until it breaks, then these are the levels we wll look for longs.

THETA/USDTTHETA/USDT
formed a recurring pattern.
An upward divergence is observed.
I expect it to suffer a bit in this Algor and then we will see the price increase.
#THETA #THETAUSDT #BTC #BTCUSD #LUNA #LUNC #UST

THETA usdt Risky businessbtc is doing it's thing so no trade is safe today.
however, theta has a nice setup.
i will look for a long at 1.111
and i will exit at 1.219 at about 10% profit.
since this is clearly a very dangerous trade,i will set a stop loss at 1.085 which is less than 2.5%.
i wont wait for candle closes,simple stop loss order because btc is not acting normal today
since the risk is small,i will use 2x on this one
also,aion from 4 hours ago did great so we some money to spare.
FOLLOW FOR MORE!

Ascending Triangle Trap - SHORT 🧨Example of HOW ASCENDING TRIANGLE DO NOT WORK!
We can see liquidity pushing trend up and been taken sharply 🔪
Follow me for more upcoming examples. Pure Smart Money Concept.
akacloudy 🌩️

THETA/USDT is looking interesting! Hey guys,
Another coin that we will talk about is THETA Network. We see from the pattern of the chart that the coin is waiting for some major movement to be happening but it is waiting for some kind of confirmation! We have two scenarios here for this coin
First one being securing $1.27 zone and going for another try to that upper line of the sideways path, which is $1.47 zone.
Second one is that Fed will make a market to collapse and Theta will go to test the lower line of sideways path which is $1.08.
What is your opinion on this coin?
If you like ideas provided by our team you can show us your support by liking and commenting.
Yours Sincerely,
Swallow Team 🔱
Disclamer:
We are not financial advisors. The content that we share on this website are for educational purposes and are our own personal opinions.

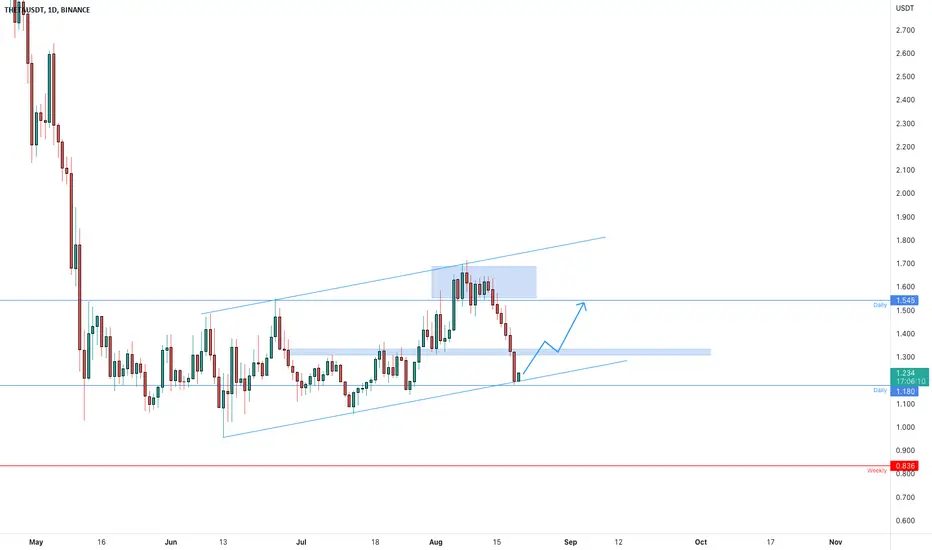
THETAUSDT is testing the supportThe price is testing the daily support inside an ascending channel on the daily timeframe.
The price got new liquidity from the false breakout in order to create a new bearish impulse until the key level
How to approach it?
IF the price is going to flip the current resistance at 1.3$ area and retest as new support, According to Plancton's strategy , we can set a nice order
–––––
Keep in mind.
🟣 Purple structure -> Monthly structure.
🔴 Red structure -> Weekly structure.
🔵 Blue structure -> Daily structure.
🟡 Yellow structure -> 4h structure.
–––––
Follow the Shrimp 🦐
THETAUSDT pullback ???buy setup for THETAUSDT; pullback
RECOMMENDED TRADE.
Take Profit 1.505, 1550
Risk to Us: 1%
begin securing your gains at lower levels
Subscribe to our TradingView Page and like it.
Please help us out by giving us likes and comments!
