THETA break a resistance level in usdt pairTHETA analysis:
#THETAUSDT broke the major resistance level and now retesting it. If THETA able to hold the $1.53-$1.55 level then we see a good rally. You can open long positions near $1.53-$1.55 with stop loss.
Targets: $1.72 - $1.90 - $2.27 - ..
THETAUSDT trade ideas


Important Brake out, By Theta for Quick Gains .Price broke out of the 85 Day accumulation phase - Horizontal channel
Currently Im looking for a retest to ride the trend.
Trade with me
Entry $1.49
stoploss $1.22
TP $2.08

Theta forecast and idea for futuresPlease write any comments or suggestions.
Dear friends, request any cryptocurrency or forex indices that you want to be analyzed.
Thanks for your attention

THETAUSDT AB=CDAB=CD
The AB=CD pattern is easy to identify on charts and consists of 2 equivalent price legs. It has specific Fibonacci measurements of each point within its structure, eliminating room for flexible interpretation. The C point must retrace to either a 0.618 or 0.786 and the BC projection is either 1.27 or 1.618. When the BC projection and the AB=CD completion converge closely and define a small area, the chance of a reversal increases.
The first target would be the 382 retracement of AD and the second target the 618 retracement of AD. A common stop level is behind a structure level beyond the D point. Conservative traders may look for additional confirmation before entering a trade, for instance an aligning RSI value or a specific candlestick pointing at a reversal. TradingView has a smart ABCD Pattern drawing tool that allows users to visually identify this pattern on a chart. There are several variations, based on CD being an extension of AB such as the 1.27 AB=CD or the 1.618 AB=CD pattern.

THETAUSDT LONG PLANbroke out of more than 2 months consolidation, expecting it to test range high support for sometime before making the move up, if 1D close back inside, will assess the situation again, targeting 3.3-3.6

abcd pattern forming on thetaa bullish signal for short term with the help of harmonics abcd pattern
tp and sl mention is chart
follow as instructed

THETA/USD SHORT TRADE ANALYSISTHETA/USD SHORT TRADE ANAL
Butterfly Bearish Pattern formed on 1H timeframe.
Stop Loss: 1.6570

THETA Try to breakout THETA / USDT
Price is try to breakout after long accumulation
If daily candle closed above resistance area this will be bullish

THETAUSDT | NEAR RESISTANCETHETAUSDT has trading near the resistance zone. The same zone seems the double top zone formation. The bears candles formation near the top will confirm the price action rejection from resistance zone.
The bulls need to break above the resistance zone. While bulls are in control below the resistance zone.
Trade your levels accordingly.

THETAUSDT is testing the resistanceThe price is testing the 4h resistance after a range between 4h structures
The price created a false breakout from the range, usually, it's not a good sign for the continuation
How to approach it?
If the price is going to have a clear breakout from the resistance and retest as new support, According to Plancton's strategy , we can set a nice order
–––––
Keep in mind.
🟣 Purple structure -> Monthly structure.
🔴 Red structure -> Weekly structure.
🔵 Blue structure -> Daily structure.
🟡 Yellow structure -> 4h structure.
–––––
Follow the Shrimp 🦐
THETA building pressure for breakout?THETA might be due for a breakout.
Watch for close on higher time frame.
Cut the trade if this turns out to be a fake.
Please let me know what you think :)

THETA 4H Theta is breaking through the box it is really good to buy in sopt will gain 20 30 % also you have to take look at total 2 .

$THETA- resume upward thrustbtc pair bouncing from the 50 ma , usd pair a tad ahead
targets on chart should have a nice rally as it breaks 1.472

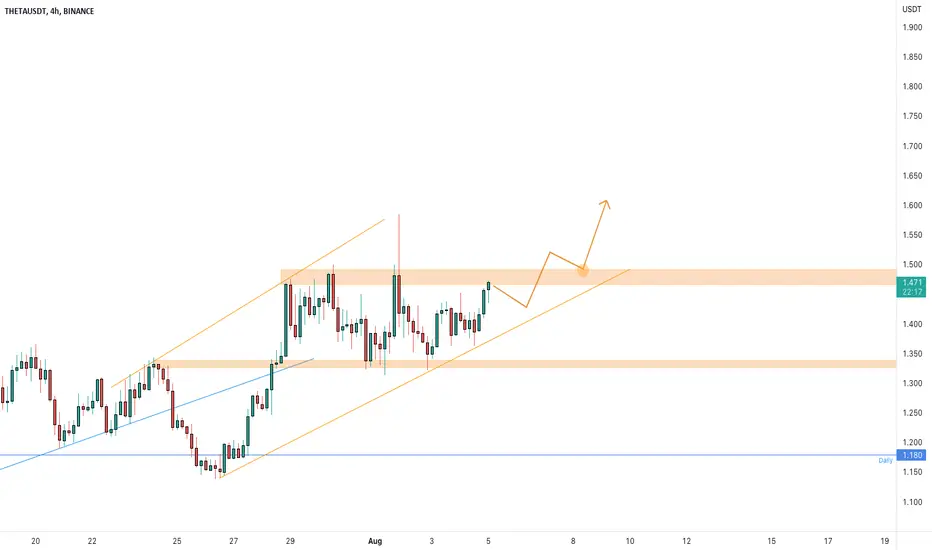
Theta Usdt Forecast / Idea After the downtrend movement and hitting the 4-H support line, started an uptrend movement towards the resistance zone around 1.500, and then the next target is daily resistance at 1.630, which is in the 1.5 Fibonacci range.


THETA/USDTTHETA/USDT
It is located in a trading area.
It has reacted twice down the channel.
We are expecting a price increase
The targets are marked in the picture.
#THETA #THETAUSDT #BTC #BTCUSD #LUNA #LUNC #UST

THETA 4Hin 4h time fram test 1.42 several time so if the btc moves up we will see a lots of up trend from this coin .

THETA Dits look very juicy iam waiting for break out from top i think we can gain 25 % on this coin.

THETAUSDT | NEAR BREAKOUTTHETAUSDT has been trading under rectangle for three months. The price has reached to the resistance level of 1.5$ where price can face little hurdle. A break above the range will give hefty return.
Tell us what do you think of the idea

THETA / USDTTheta still in consolidation as long as we are between swing low & swing high that's means we're on bullish structure

THETAUSDT Di think every body have to put this coin to watchlist if break the upper line it goes so much high high ///

what a good entry point!There is no resistance till 2.257, it seems that it has the potential to pump technically if we don't lose support under the rectangle it has about 75% above its current price.
