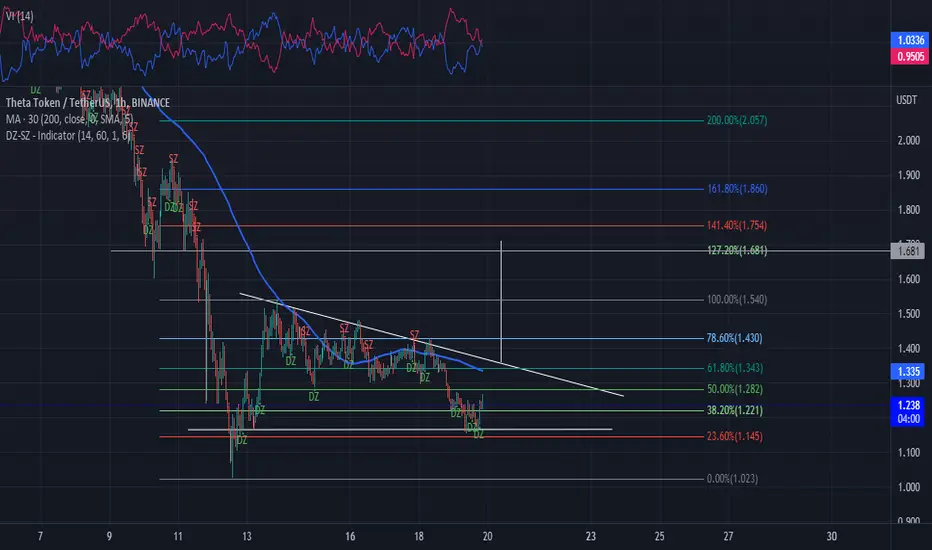
Long Position THETAUSDT. Deep Crab Patter SpottedThis trade might take a few days, so it's better to put only capital that you can leave for a long period of time. BTC is shooting a little bit up. If that continues, there's a possibility that this setup will be success.
When the trade looks well, always move SL to avoid loss.
Note: Check BTC if btc just shown a fakeout then suddenly crash, this setup should be cancelled.
THETAUSDT trade ideas

THETAUSDT PLANexpecting something like this ,will long once it above the daily open for a move into range high


THETA possible movementTheta have break through a strong support and now ranging in a breakout which have now test resistance of the new range but couldn't break hence at the signal of a candle stick indicating sell , we might look to short to 1.08 , Sl can go 1 atr above resistance

THETA formed a bullish Gartley for upto 2200% massive moveHi dear friends, hope you are well and welcome to the new trade setup of Theta coin.
On a monthly time frame, Theta has formed bullish Gartley pattern.
Strong support at $0.57
Note: Above idea is for educational purpose only. It is advised to diversify and strictly follow the stop loss, and don't get stuck with trade

THETAUSDTHello Crypto Lovers,
Mars Signals team wishes you high profits.
This is a 4-hour-time frame analysis for THETAUSDT
Based on our previous analysis on May 22, we predicted more decline for the price and now you see our prediction is correct. In this chart, the price could not move over the R1 line and it was rejected. At one of the rejections, it had a fall and entered a previously support area (now R2 line). After losing this previous support area, had a fluctuation below R1 line and now it has broken the R1 and we expect the price to move down and face more decline. In case the price moves to the other resistance areas, we will have more rise for it.
Warning: This is just a suggestion and we do not guarantee profits. We advise you to analyze the chart before opening any positions.
Wish you luck

THETA - How tight is your grip?As I had mentioned in my previos idea here: you really have to buckle up and hold tight for this bumpy ride - and boy this one is bumpy.
In my update from a day ago on the idea above I had mentioned my buy order around 1,79$ (demand zone and purple support level) and it got executed - so I am actually happy about this. You can see how the price touched the purple level (weekly) and then got rejected.
So what's next? Well unfortunately the price moves are heavily correlating to $BTC - so we will watch closely what $BTC will do - and it does not look like the end of it, when you look at the weekly and monthly volume with the price decline.
The good news for $THETA on the other hand is that even though price does decline, so does volume (weekly/monthly). So I am not worried and since I believe in the product itself and see intrinsic value in it, I will wait for calmer times.
Make sure to keep enough cash in your account to accumulate and average down when you find a product/stock/cryptocoin you believe in.
For reasons of transparency: I am invested with 1/2 of my account size in $THETA and keep 1/2 as buffer cash to buy dips.
Stay healthy!

theta don”t wait it lower then 0.80$Theta,
First of all, if you want to accumulate theta, don't expect it below $ 0.80, but we are in a perfect range to fill our wallets.
so far we have a 92% correction ❤

THETA/USDT
THETA / USDT
It is located inside a descending canal that has broken both the bottom of the canal and lost its support.
It is expected to fall in the range of 55 cents.

THETA/USDT is going up soonGood morning/evening/afternoon
We sow a good potential for THETA/USDT coin. Our main target for this coin is $2.65 where we could witness a pullback before going to $3.8 Right now it is sitting at a very strong support and the red box area would be our buy.
We suggest you to set few entries in the red box and wait for THETA do breakout.
If you like ideas provided by our team you can show us your support by liking and commenting.
Yours Sincerely,
Swallow Team
Disclamer:
We are not financial advisors. The content that we share on this website are for educational purposes and are our own personal opinions.

THETAUSDTHello Crypto Lovers,
Mars Signals team wishes you high profits.
This is a 4-hour-time frame analysis for THETAUSDT
Obviously, the price has entered a descending channel and after reaching the first support line, it is now fluctuating above this line. The point is that it has not lost its support line and we believe it will move to the first resistance line and will face more rise. But if the opposite happens and the price moves downward, it will have more decline.
Warning: This is just a suggestion and we do not guarantee profits. We advise you analyze the chart before opening any position.
Wish you luck

Still big draw down for ThetaI am a seller of Theta at 1.30, looking to re-enter after another 40% drawdown to around 0.79. Macro outlook is not going to favour altcoins for the next few months. I am long term bullish and will enter with a fairly large position when we hit the lower target.

THETA scalp opportunity Hey, overall we are still gamma short and market is just not heating up - nevertheless Im expecting some nice relief rally (given current levels and the time frame we've been correcting..) $THETA is looking for a nice scalp opportunity, with simple invalidation.
Im taking this with x3 leverage and bigger position - please respect the SL. Lets see how this worksouts

Theta Binance Coin M Macro SetupI don't see us having a chance to buy at the green box prices anytime soon. I think first 2 weeks of June will consist of bullish news pumping the markets 10-20% before the real pain would come later in the month. I would stick to the plan, taking out emotions and letting plan abc ride.

THETA - 1D1D chart for THETA
support zones & resistance zones
Information purposes only
Like if u like chart
@Cringeego


THETAUSDT H1SELL ENTRY @2.621
STOP LOSS@2.770
TAKE PROFIT@2.471
Market Update (Looking to Long) Like and Subscribe
Thank you Please support our analysis with a like or comment!


THETA 3 day chart has nothing but upside? i believe so!THETA 3 day chart has dropped tremendously...
Im shocked at the value of this token at this price.
This THETA eco-system is definitely one of the most
impressive. With TFUEL, TBILL, TDROP and with
expansion of broadband internet,
and the NFT marketplace ranking in the top 5.
We will see much higher numbers in the near future.

THETA: Hold on tight for a bumpy ride & Watch the Trading Range!I know this is a shaky and bumpy ride, but the real question is: Do you believe in the technology and vision?
There are so many coins that have no intrinsic value, but a few actually do:
PUNDIX offers real physical products for paying with crypto, VeChain can actually solve supplier-chain issues and Theta does not only help with fair bandwidth allocation, but enterprise validator nodes are run by "Google, Samsung, Sony, Creative Artists Agency (CAA), Binance, Blockchain Ventures, DHVC and gumi. Theta leverages its user base of millions of viewers on the Theta Network to seed its peer-to-peer video network along with premium content partnerships with Lionsgate, MGM Studios, NASA, and others. Popular video platforms integrated with Theta infrastructure include CONtv Anime, Party Poker, World Poker Tour, Cinedigm, Samsung VR, GameTalkTalk, MovieBloc, Ultra, GFUEL and other OTT media, entertainment, and live streaming services. Strategic corporate investors include Samsung NEXT, Sony Innovation Fund, Bertelsmann Digital Media Investments (BDMI), Creative Artists Agency (CAA), and Silicon Valley VCs including DCM and Sierra Ventures." - docs.thetatoken.org
There are actually some more valuable coins (in my opinion) like Dent, SiaCoin etc., but you have to do your own due-diligence.
So, back from advertising to trading ;) I have highlighted the trading range for $THETA with a yellow box - our candles should close within that (especially weekly and monthly candles). Wicks can be outside of the box, but that's it. When 4hr candles close outside of the trading range, you will see them as a wick on the weekly or monthly chart - no need to be alarmed there and it takes strong nerves, because these shakeouts are sometimes pretty heavy. Large operators try to get the coins/shares as cheap as possible from retail investors, so they flood the market with supply; retail investors panic, sell their coins to "the market" (actually whales) and then the price takes off and large operators will sell the coins back to the same naive investors, who sold their coins at a bargain to them - kind of sickening isn't it?
All I can say is hold on tight for a bumpy ride and of course this is no financial advise, just some prep talk :D
Remember: "Nothing worth having comes easy." ― Theodore Roosevelt
For reasons of transparency: I am invested in $Theta with 1/4 of my account size. 3/4 are kept for buffer cash to buy sudden drops in price.
Stay healthy everyone!

thetausdti think that theta is now good for long postion
put stop loss plz
2.25 is tp 1
and 2.32 is tp 2
