THEUSDT long to $0.26 TodayJust went long on THEUSDT anticipating an end of day pump up to daily lower high for THEUSDT.
Stop: $0.2412
Tp1: $0.2532
Tp2: $0.26
I might hold until full tp
THEUSDT trade ideas

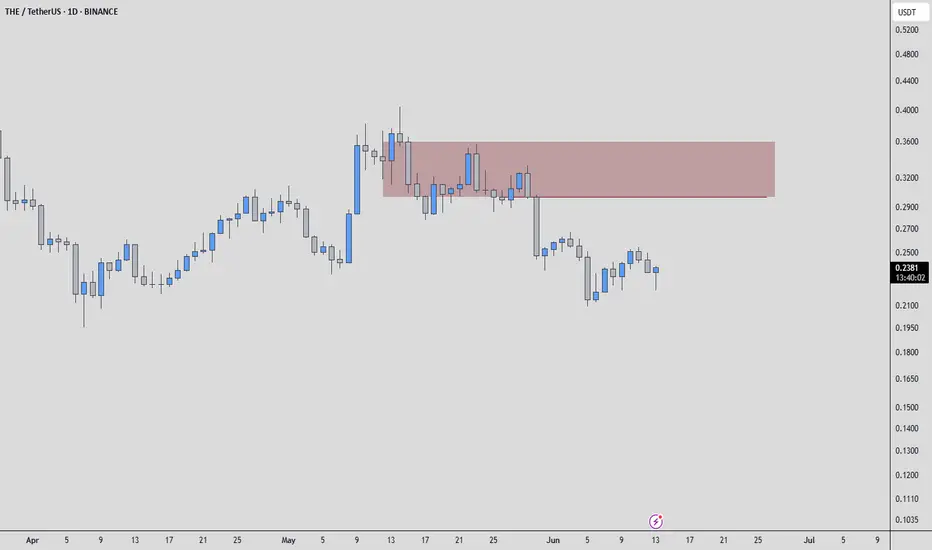
THEUSDT Analysis: Weak Buyers and Downside ConfirmationOn THEUSDT, my current observation is clear: buyers are extremely weak. This isn't just a hunch; the underlying order flow and volume dynamics point to a lack of conviction from the bullish side.
Because of this noticeable weakness, my focus will be squarely on the red box I've identified on the chart. This area is where I'll be actively seeking downward confirmations on lower timeframes. This means I'm looking for signs like:
Failed attempts to rally: Price pushing up into the red box but quickly getting rejected.
Increased selling volume: A spike in volume on bearish candles as price interacts with or breaks below this zone, especially on the volume footprint.
CDV (Cumulative Delta Volume) turning decisively negative: This would signal that sellers are genuinely taking control.
Low Timeframe (LTF) breakdowns: Clear bearish structures forming, like lower highs and lower lows, coupled with retests of broken support as new resistance.
Remember, my strategy dictates that I only analyze and consider trades on coins showing a sudden and significant increase in volume. While THEUSDT's current context may not be about a sudden bullish volume spike, the analysis of existing volume and order flow within this weakness is crucial.
The market rewards patience and confirmation. I will not be looking for long opportunities here. My attention is entirely focused on finding those bearish confirmations within the red box. If they materialize, it presents a clear directional bias for a downside move.
📌I keep my charts clean and simple because I believe clarity leads to better decisions.
📌My approach is built on years of experience and a solid track record. I don’t claim to know it all but I’m confident in my ability to spot high-probability setups.
📌If you would like to learn how to use the heatmap, cumulative volume delta and volume footprint techniques that I use below to determine very accurate demand regions, you can send me a private message. I help anyone who wants it completely free of charge.
🔑I have a long list of my proven technique below:
🎯 ZENUSDT.P: Patience & Profitability | %230 Reaction from the Sniper Entry
🐶 DOGEUSDT.P: Next Move
🎨 RENDERUSDT.P: Opportunity of the Month
💎 ETHUSDT.P: Where to Retrace
🟢 BNBUSDT.P: Potential Surge
📊 BTC Dominance: Reaction Zone
🌊 WAVESUSDT.P: Demand Zone Potential
🟣 UNIUSDT.P: Long-Term Trade
🔵 XRPUSDT.P: Entry Zones
🔗 LINKUSDT.P: Follow The River
📈 BTCUSDT.P: Two Key Demand Zones
🟩 POLUSDT: Bullish Momentum
🌟 PENDLEUSDT.P: Where Opportunity Meets Precision
🔥 BTCUSDT.P: Liquidation of Highly Leveraged Longs
🌊 SOLUSDT.P: SOL's Dip - Your Opportunity
🐸 1000PEPEUSDT.P: Prime Bounce Zone Unlocked
🚀 ETHUSDT.P: Set to Explode - Don't Miss This Game Changer
🤖 IQUSDT: Smart Plan
⚡️ PONDUSDT: A Trade Not Taken Is Better Than a Losing One
💼 STMXUSDT: 2 Buying Areas
🐢 TURBOUSDT: Buy Zones and Buyer Presence
🌍 ICPUSDT.P: Massive Upside Potential | Check the Trade Update For Seeing Results
🟠 IDEXUSDT: Spot Buy Area | %26 Profit if You Trade with MSB
📌 USUALUSDT: Buyers Are Active + %70 Profit in Total
🌟 FORTHUSDT: Sniper Entry +%26 Reaction
🐳 QKCUSDT: Sniper Entry +%57 Reaction
📊 BTC.D: Retest of Key Area Highly Likely
📊 XNOUSDT %80 Reaction with a Simple Blue Box!
📊 BELUSDT Amazing %120 Reaction!
📊 Simple Red Box, Extraordinary Results
📊 TIAUSDT | Still No Buyers—Maintaining a Bearish Outlook
📊 OGNUSDT | One of Today’s Highest Volume Gainers – +32.44%
📊 TRXUSDT - I Do My Thing Again
📊 FLOKIUSDT - +%100 From Blue Box!
📊 SFP/USDT - Perfect Entry %80 Profit!
📊 AAVEUSDT - WE DID IT AGAIN!
I stopped adding to the list because it's kinda tiring to add 5-10 charts in every move but you can check my profile and see that it goes on..
Thena: Hold Until The End (1,337% Profits Potential)Which one will you take? Endless opportunities the Cryptocurrency market has to offer; which one will you take?
Doesn't need to be just one can be many. You can choose many pairs to trade.
Countless opportunities are available now and these will be generating huge profits in the coming days.
The first burst forward will produce 100%, in 1-3 days. And this will be followed by sustained long-term growth. It will grow so much and for so long, that you will become bored. It won't be exciting anymore... Until the correction of course.
Thena here has more than 1,000% potential for growth. Right now this pair, THEUSDT, is sitting on a higher low or double-bottom, in this case it is the same.
This is the same pattern produced by Ravencoin, remember?
That project that grew more than 150% in a single day. "Altcoins Market Bull Market Confirmed, Ravencoin." And it is true, watch everything grow.
This same pattern is present on so many altcoins, not all of them but many and we know exactly what will happen next because what one does, the rest follows.
THEUSDT is about to go bullish, can take a few weeks or less, a few days.
When the bullish wave starts it will go for months, months of sustained growth. You simply hold until the end.
Thank you for reading.
Namaste.

THEUSDT 1D AnalysisTHE ~ 1D Analysis
#THE This trade is very high risk
Buy from here if you still have confidence in this coin with a short term target of at least 15%+ from here.

THEusdt big pump tonightRecently entered long on THEUSDT.
Called it in the chat.
Stop: 0.2323 or lower
Target: $0.2480
4RR+
We finna pump hard.
DTT strategy applied. Learn more about it on my X profile, highlight section.

THE analysis:Price tested the support area and formed a double bottom pattern. You can accumulate some near the support area.
Support Area: $0.2080-$2220
Resistance Area: $0.2940-$0.3050

THEUSDT long to $0.32Just now opened a long position on THEusdt.
Targeting 0.32
Stop: $0.2835 or lowr
Partials on chart.
Market is trending up. Anticipating continuation of trend. Also global market sentiment seems to be more bullish at the moment than bearish.

THEusdt expected to Print todayAnyone following me right now seeing this is living life on easy mode>
I expect this THEUSDT long to print today. Likely breakout any moment now.
Targeting $.3208
potential 50% partial at $0.2947
And for mods reading this thinking its not valuable - If you want to learn the strategy checkout the links- Otherwise learn what you can from my chart using context clues and your own understanding...which might not reflect any of my thought process but me sharing my chart alone provides a lot of value. If shown a group of them to Ai, Ai would probably make a very smart guess on how am trading but it would be limited to the timeframe seen here...which is not what my analysis is based only.

My own setup for #THEHI Dears,
my own setup for buy opportunity #THEUSDT #theusdt
Entry 1 : 0.2182
Entry 2: 0.2114
you can see partial exit points if you will see pullback patterns with 5TPs.
stop loss: 0.2071 (3.49%)

THEUSDT scalp long to $0.2661Just now opened a long position on THEUSDT
Scalp long.
Aiming for $0.2661 quick target.
Betting on straight push up from here without drawdown

THEusdt short back to $0.2170Just recently opened a short position on THEusdt . I anticipate that the market will dump off again back down to $0.2170 area today.
Some demand is coming in but I think there will be enough selling pressure at this are to suppress the price

THEusdt short now!Just now opened a short position on THEusdt. I anticipate a fall down towards $0.2167 area today.
Roughly 2.5RR
DTT setup

THEUSDT LONG to $0.2615Just now opened a long position on THEUSDT. It spiked up right after.
Anticipating a push to $0.2516 at least. I'll monitor if am awake. If not I'll set limit orders to scale out

THEUSDT short to 20 centsI expect this trading day to be a red day for THE. Bulls did well yesterday but its just a correct thus far. The overall trend is still down and I believe it will continue back down from here.
DTT setup

THEUSDT LONGJust now opened a long position on THEUSDT. Am expecting a quite pump today back up to $0.37 area where I'll be looking to exit.

THEUSDT Long now ! $0.3730I just recently opened a long position on THEUSDT. Am targeting $0.372. I anticipate that it will breakout and start pumping any moment now.
My tp is open but looking to exit at least 80% around $0.372 area

THE Trying To Bottom - Knife Catch MartyBoots here , I have been trading for 17 years and sharing my thoughts on ETH here.
THE is trying to bottom and bounce in the near term
This is a risky knife catch so be careful
Interesting situation and potential trade

THEusdt long to $0.7 now!!I just recently opened a THE long. I anticipate a breakout very soon. I think this token is gonna rip and pump potentially all the way to $0.7 before it continuses back down. Its been itching to pump

THE short to $0.5163 areaI just now opened a short on THE. Now the moment I entered it rejected right way so basically have no draw down.
Trend is still down, and I think this is just a correction to then continue the push down.
...Okay time sensitive.
Posting.

Thena: Simply Bullish (555% Potential)It is no longer necessary to proof that the bottom is in for the Altcoins market, this is clearly confirmed as it happened a while ago, more than three weeks ago.
Here, on the THEUSDT (Thena) chart, it can be seen as a low hit 3-February. With a higher low hit Tuesday (25-Feb), this pair is turning green.
This is easy, simple but bullish.
The blue line on the chart marks the downtrend. A descending trendline. As soon as the action moves above this line the downtrend is confirmed broken. The market bias changes from bearish to bullish. THEUSDT is now in the bullish zone with bullish potential. The higher low reinforces this notion/signal.
Notice how after the 12-February bullish breakout there are three reactions on the same down-trendline that was once a strong resistance. Resistance turned support. This trendline was tested and it holds. Now that it holds prices can easily move up. It is still early though.
Another signal comes from the 0.148 Fib. extension level. The action is moving above this level today. A close above this level further strengthens a bullish case.
Finally, we have EMA13, the orange line on the chart. Once the day closes above it bullish tendencies are confirmed. Simple, yet bullish.
We have two targets mainly based on the short- and mid-term. One target goes for 325% and the next one goes for 555%.
Patience is key.
Buy and hold.
The Altcoins market is bullish now.
Thank you for reading.
Namaste.

THe scalp short to $0.54I just now entered a short on THE . Targeting $0.54 area
Scalp short. Afterwards I anticipate a bullish bounce. Just looking to get in and out quickly

THE short down to $0.4950I opened a short a while ago on THE. Been monitoring it since last night in anticipation of a bigger correction but seems the supply is relatively strong and it might just dump off from here towards $0.4950 area
Hence why I took a position.
Ideally I would have liked for it to correct all the way ack up to $0.596 area but we'll see. If I get stopped out that might be where next entry will come in.

Bearish on $THE (Binance Futures)1. We have price reacting off from the premium H4 OB-
2. We have a buyside purge
3. We have a CISD o H1
4. Price is at premium
5. We have discount draws as the H1 OB- AND BREAKERS
