Dow Jones Potential DownsidesHey Traders, in today's trading session we are monitoring US30 for a selling opportunity around 44,300 zone, Dow Jones is trading in a downtrend and currently is in a correction phase in which it is approaching the trend at 44,300 support and resistance area.
Trade safe, Joe.
US30 trade ideas

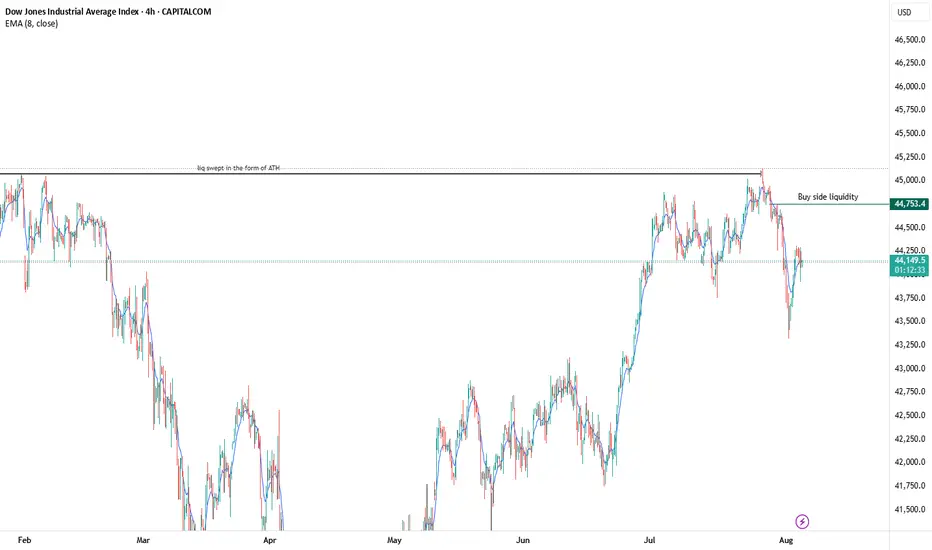
US30 Sell offmajor move to the downside coming up, once we get the buyside liquidity sweep ill be looking for a heavy short position. Liquidity has already been sept in the form of equal high at the area of all time high. the internal liquidity is what I'm looking for to get swept, then its all down hill from there. I will be holding this until it reaches a daily or monthly demand zone
KOG - US30Moving on from the previous chart we shared on DOW you can see our red box worked well and gave us the move we wanted upside, however, we stopped just short of the ideal target level.
For that reason, and after looking at the liquidity indicator we will monitor the boxes here for a possible retracement.
As always, trade safe.
KOG

US 30 Index – Potential Rebound or Deeper Retracement Ahead?Just as the US 30 became the last of the three major US indices to register a new all time high last Monday at 45160, on a final wave of positivity generated by the announcement of a trade deal between the US and EU, it was snatched away again as traders used the up move to take profit on longs.
This initial fall evolved into 5 straight daily declines which took the index from its record high of 45160 on Monday to a Friday close at 43591 as the sell off accelerated, driven by disappointment of a more hawkish than expected Fed, a new wave of trade tariffs from President Trump, weaker Amazon earnings , and on Friday, perhaps the biggest surprise of all, a Non-farm Payrolls release that showed the US labour market may be weakening faster than anticipated.
Looking forward, with the shock of Friday’s data reverberating through markets, US 30 traders still have lots to think about this week. The US ISM Services PMI release is due at 1500 BST on Tuesday. Service activity has been the major driver of growth in the US economy for the last 18 months, so this new update could have a big influence over where the US 30 index moves next. Any reading below 50 = economic contraction, while readings above 50 = economic expansion, and traders could well be focused on how this month’s print stacks up against last month’s reading of 50.8.
The earnings releases of 3 bellwether US corporates may also be relevant, given their US 30 index weightings. Caterpillar reports its Q2 results before the market open on Tuesday, with McDonald’s and Walt Disney reporting before the open on Wednesday. Traders may be looking to compare actual earnings against expected, alongside assessing any future revenue guidance that is provided against the current trade tariff operating environment.
Now, while the US 30 index has opened this new trading week on a more stable footing, currently trading up 0.25% at 43705 at the time of writing (0530 BST), assessing the technical outlook for the week ahead could also be useful for traders.
Technical Update: Deeper Retracement Risk Emerging?
While it might be argued that it was the reaction to the latest US employment data that saw US equities encounter fresh selling pressure, as the chart below shows, prices were already declining into Friday’s payrolls release.
Price weakness was materialising in the US 30 index right after it posted its new all-time high on Monday July 28th at 45160, and traders might now argue that last Thursday’s close below support provided by the Bollinger mid-average, currently at 44412, was the first potential indication that a more extended phase of price weakness was possible. The case was then perhaps strengthened by Friday’s negative reaction to the payrolls data, which saw closing breaks under support provided by the July 16th last correction low at 43770.
There is of course no guarantee that this price action will result in a retracement of the April 7th (36440) to July 28th strength (45160), but assessing what may be the potential support and resistance levels to monitor this week could be helpful, if the recent volatility continues to dominate price action at the start of August.
Possible Support Levels:
Last week’s price decline held at the 43337 level which was the August 1st low, and having previously found buyers at this point, they may be found again. As such, this 43337 level could now prove to be the first support focus for the week ahead.
Closing breaks below 43337, if seen, could lead to the possibility of further price declines, opening potential to test the next support at 41824, which is the 38.2% Fibonacci retracement of April to July 2025 price strength (see chart above).
Possible Resistance Levels:
Having now seen the Bollinger mid-average for the US 30 index turn lower after last week’s fall, this may now be the first resistance level to watch on any subsequent rally higher. It currently stands at 44442 and watching how this level is defended on a closing basis could be useful.
If a more sustained phase of price strength is to materialise, it could be closing breaks above the mid-average at 44442 that increases the possibility of it happening. Such moves could then see retests of the July 28th all-time high at 45160, possibly higher if this level is then breached on a closing basis.
The material provided here has not been prepared accordance with legal requirements designed to promote the independence of investment research and as such is considered to be a marketing communication. Whilst it is not subject to any prohibition on dealing ahead of the dissemination of investment research, we will not seek to take any advantage before providing it to our clients.
Pepperstone doesn’t represent that the material provided here is accurate, current or complete, and therefore shouldn’t be relied upon as such. The information, whether from a third party or not, isn’t to be considered as a recommendation; or an offer to buy or sell; or the solicitation of an offer to buy or sell any security, financial product or instrument; or to participate in any particular trading strategy. It does not take into account readers’ financial situation or investment objectives. We advise any readers of this content to seek their own advice. Without the approval of Pepperstone, reproduction or redistribution of this information isn’t permitted.

US30 Bearish Breakout!
HI,Traders !
#US30 made a bearish
Breakout of the key horizontal
Level of 44822.3which also
Seems to have been a neckline
Of the small H&S pattern so
We are locally bearish biased
And we will be expecting a
Further bearish move down !
Comment and subscribe to help us grow !

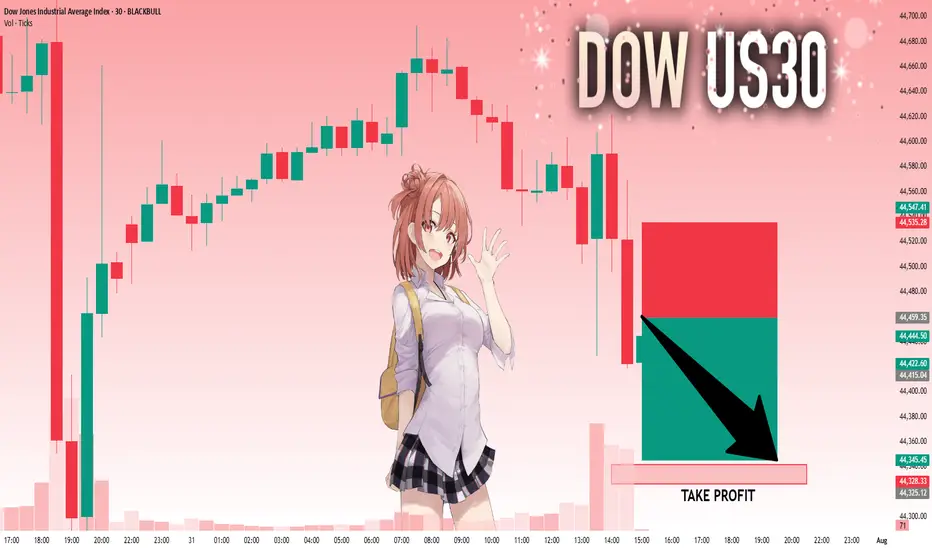
Us30usd sellI entered a sell trade from the LS zone. The PEZ zones were all used up. I set the last one as my TP.


US30: Absolute Price Collapse Ahead! Short!
My dear friends,
Today we will analyse US30 together☺️
The in-trend continuation seems likely as the current long-term trend appears to be strong, and price is holding below a key level of 44,459.35 So a bearish continuation seems plausible, targeting the next low. We should enter on confirmation, and place a stop-loss beyond the recent swing level.
❤️Sending you lots of Love and Hugs❤️

SHORT ON US30US30 Has given us a nice CHOC (Change of Character) to the downside.
This indicates a huge potential of US30 dropping more after it pulls back into the supply zone that created the change.
Dollar news is also a catalyst today for this play. If news comes out good for PMI and makes the dollar rise... US30 could fall almost 3000 points over the next few days.
Take Advantage.


Dow Jones August GameplanNow that the first trading day of August has printed, can one reliably forecast the possible month based on just the first day? I am inclined to believe that one can with a small amount of accuracy. Not perfect.
There are two types of monthly cycles when the first traded day is a bearish candle right from the open of the month.
Type 1 is a bearish trending cycle that trends lower and lower. It is then followed up by small number of bullish pullbacks halfway through the month before rolling back over and closing near the lows.
Type 2, more common, is when the first traded day is bearish right from the get-go as well, trades lower but reverses near the beginning of the month before trading higher than the open and forming a bullish bar.
So, in my opinion, there are only two probably outcomes for August.
Type 1:
Type 2:

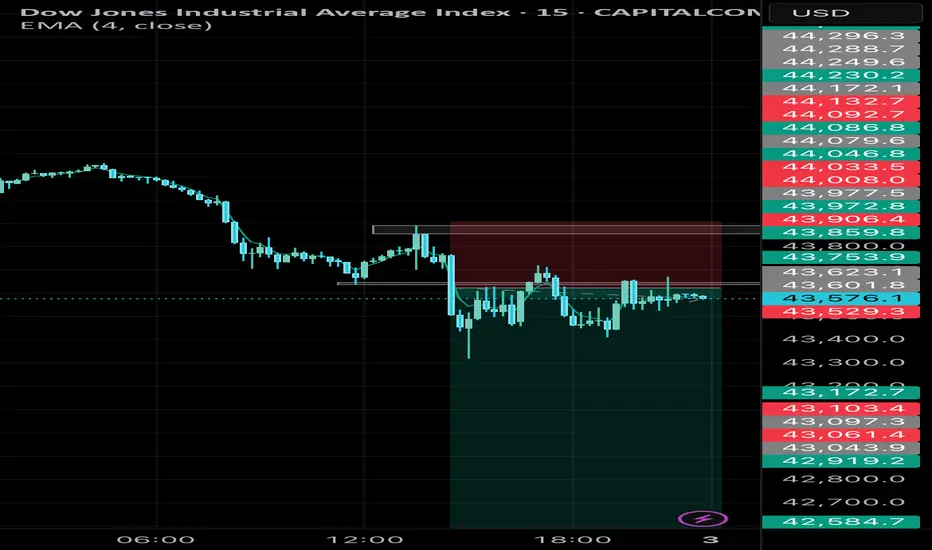
US30 (15M) – Bearish Reversal Setup, Short Opportunity📊 Analysis:
The US30 index on the 15-minute chart is showing signs of a bearish reversal after a recent upward push. Key technical observations:
1. Price Action & Structure
* US30 has been trading in a minor uptrend, but momentum is weakening.
* The latest 15M candles show lower highs forming near resistance, suggesting exhaustion in buying pressure.
2. Resistance Zone
* The price is rejecting a strong intraday resistance zone near 43641.90.
* Multiple failed attempts to break above this level reinforce it as a key barrier.
3. Target Levels
* First support target: 43206.96 – a minor support from previous structure.
* Secondary target: 41911.76.
4. Risk Management
* Suggested stop-loss: Above the recent swing high.
* Risk/reward ratio: Aim for at least 1:2 to ensure proper trade efficiency.
✅ Summary:
US30 on the 15-minute chart is showing a bearish setup.
⚠️ This analysis is for educational purposes only and not financial advice. Always use proper risk management.
DOW/US30 - PATIENCE IS THE KEYTeam, i expect the DOW/ NAS will be selling off due RATE unchange
i am going LONG now at 44335-44300 ranges
STOP LOSS at 44195
Target 1 at 44500-44550
Target 2 at 44600-44630
LETS GO
By the way, if you trade AUS200 today, both target hit on SHORT.
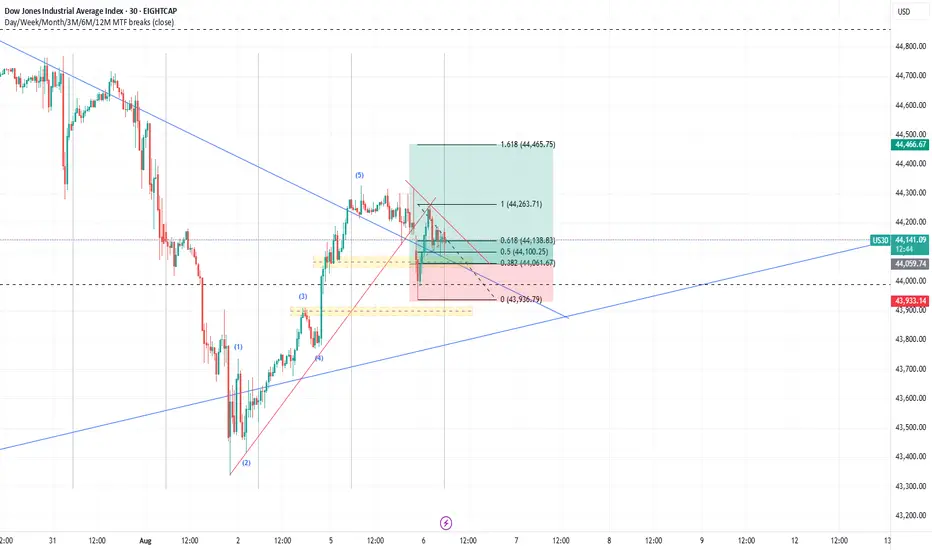
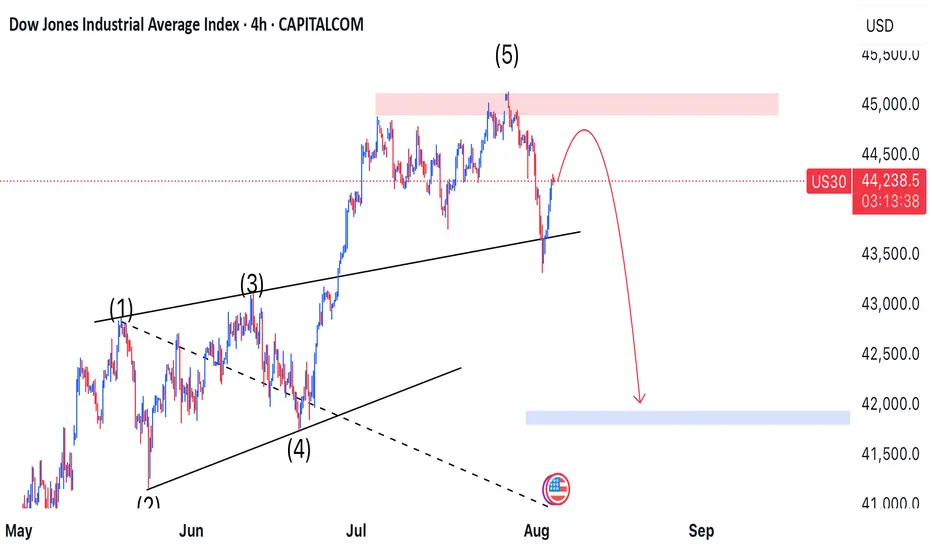
*US30: Fifth Wolfe Wave in Play—Correction Offers Prime Shorting📉 *
The US30 index has completed its **fifth Wolfe Wave**, initiating the expected downward move. While price is currently undergoing a corrective bounce, this retracement is shaping up to be a golden opportunity for sellers.
🔍 **Technical Breakdown**
- ✅ Wolfe Wave structure is confirmed, with wave 5 marking the turning point.
- 🔄 Current price action shows a **corrective pullback**, typical after the initial drop.
- 📌 Any upward movement is viewed as a **strategic entry point for short positions**.
🎯 **Target Zone**
We’re eyeing a descent toward the **41,700 level**, which aligns with the equilibrium line drawn between **waves 1 and 4**—a classic Wolfe Wave target.
⚠️ **Trade Insight**
This setup blends harmonic precision with tactical timing. As long as price remains below the wave 5 peak, the bearish bias holds strong. Sellers are watching for signs of exhaustion in the correction to strike.
---
Dow Jones Triple Top & Critical Trendline Break - Buy The Dip?Potential Tripple Top formation spotted on the Dow. This would represent a full fibonacci retracement, which leads me to believe a 38.2 retest is likely. If this 23.6 level can hold support and price does not close below the fib band (orange channel), then the bullish continuation to new all time highs can still happen in Q3/Q4 of this year. The clear trendline break dating back to April is very concerning (white line), leading me to believe more downside in the coming weeks.
Let me know what you think in the comments!
Thanks

US30 Rejected Support at 43340 – Bearish Below 43960US30 – Overview
The price rejected perfectly from the projected support at 43340 and currently maintains a bearish momentum as long as it trades below the pivot level at 43960.
As long as the price remains under this level, we expect a move toward 43630, and a break below that may lead to a retest of 43340.
However, a 4H candle close above 43960 would shift the outlook to bullish, with upside potential toward 44170 and possibly 44360.
Support: 43630 • 43340
Resistance: 44170 • 44360
Bias:
🔻 Bearish below 43960
🔺 Bullish confirmation on 4H close above 43960

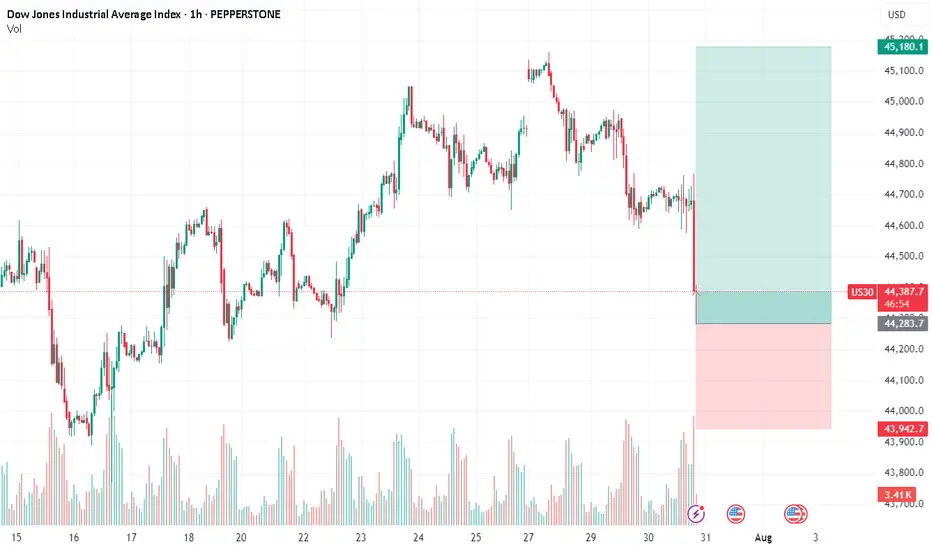
US30 short movePrice had broken our support level and hence i expect a rest to the new formed resistance before resuming its bearish move.
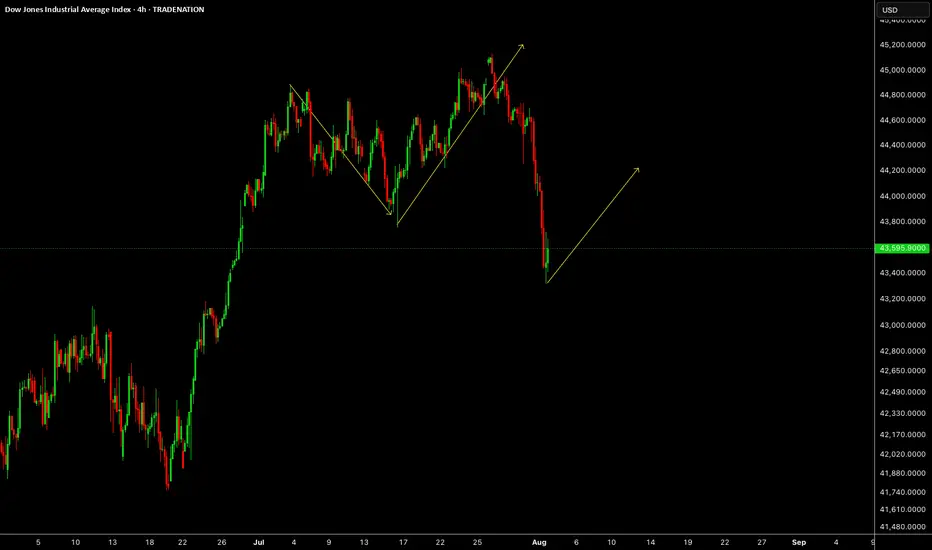
US30US30 was expected to drop last week which is what market has done. This week we need upside correction or impulse.
Disclosure: We are part of Trade Nation's Influencer program and receive a monthly fee for using their TradingView charts in our analysis.
US30 Faces Pressure Below 44610US30 Overview
Technical Outlook:
US30 is showing bearish momentum while trading below the pivot zone at 44610. As long as the price remains under this level, downside pressure may continue toward 44360, with further support at 44180.
However, a confirmed breakout above 44720 would shift the bias to bullish, opening the path toward 44910 and potentially 45100.
Support Levels: 44480 • 44360 • 44180
Resistance Levels: 44720 • 44910 • 45100
Bias: Bearish below 44610, Bullish above 44720

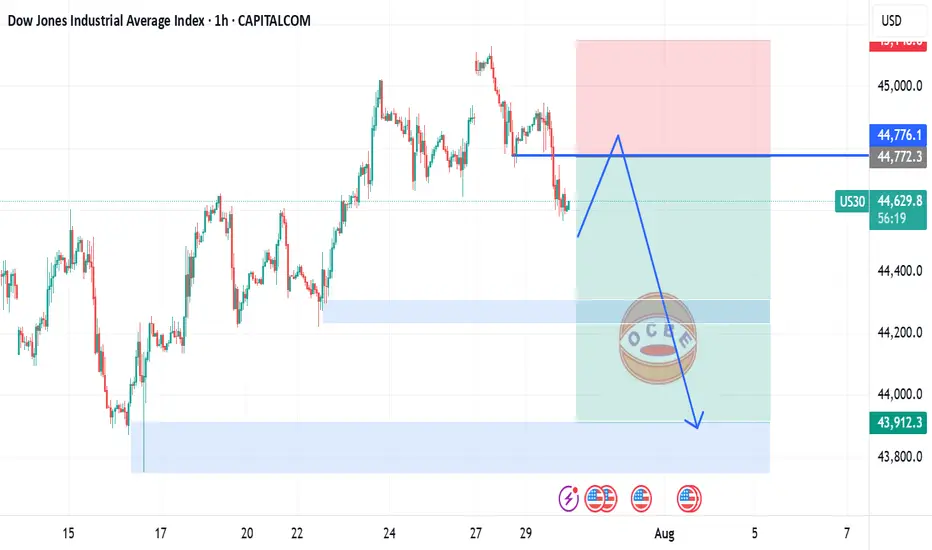
US30 Swing Short!
HI,Traders !
#US30 keeps falling down
And the index broke the
Key wide horizontal level
Around 43924.6 which is now
A resistance and the breakout
Is confirmed so we are very
Bearish biased and we will
Be expecting a bearish
Continuation on Monday !
Comment and subscribe to help us grow !

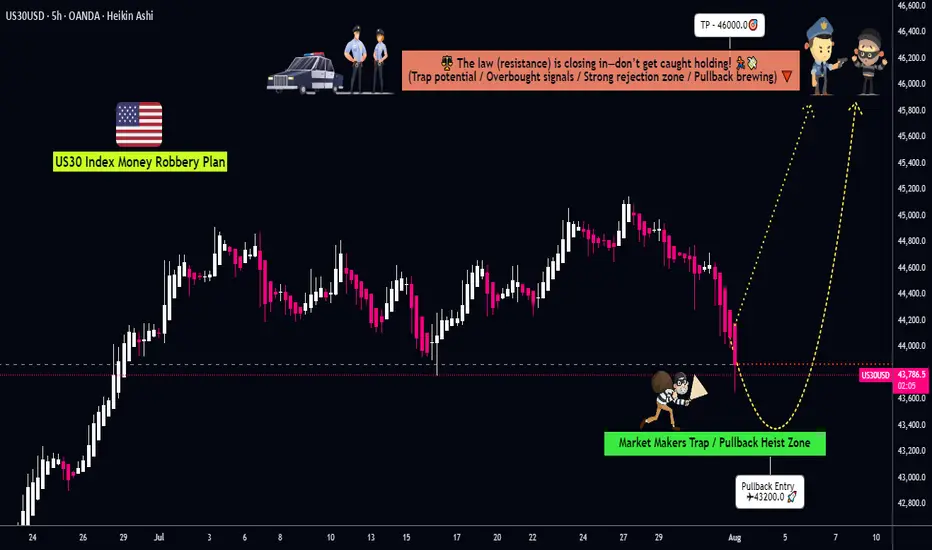
Dow Jones: Explosive US30 Trade Setup – Entry,Trap & Exit Mapped💎 Dow Jones Robbery Blueprint: The US30 Vault Crack Plan 💎
(Maximized for reach — within TradingView title limit)
🌟Hi! Hola! Ola! Bonjour! Hallo! Marhaba!🌟
Dear Market Robbers & Money Movers 🕵️♂️💰🚨
This ain't your average analysis — it’s a Thief Trader-style 🔥tactical mission🔥 aimed at the mighty "US30/DJI" (Dow Jones Industrial Average). We're talkin' about a precision heist with a full blueprint: entry zones, trap setups, and escape exits. Read carefully — this ain’t for the faint-hearted traders! 🧠🦾
🧠 Entry Zones (The Break-In) 📈
🛠 ENTRY 1: Candle wick near 44200.0 – that’s the resistance gate. Wait for confirmation.
🎯 ENTRY 2: Sneak in at the Market Makers’ Trap around 43200.00 – a dirty zone where retailers get baited. Perfect time to strike long!
🧱 DCA/Layering strategy recommended. Stack those buy orders like a thief layering explosives on a safe. 💣💸
🛑 Risk Levels (Escape Routes/Stop Loss)
🔊 "Listen up, vault raiders! Never drop your SL until breakout is confirmed. If you jump early, you might land in a bear trap! 🪤"
🔐 Stop Zones (Based on Strategy):
🔐 Max Risk SL (5H TF): If you're deep, your last stand is at 43000.0
☝️ SL depends on your position sizing, number of entries, and risk appetite. Trade like a thief, not a gambler.
🎯 Heist Target (Profit Exit)
🏁 Escape Point: 46000.0 — or exit before heat rises! Don’t be greedy. Rob and vanish. 💨💰
🔥 Market Mood: Why the Heist Is On
"US30/DJI" is bullish AF — thanks to:
📊 Macro-Economic Wind at Our Back
📈 Institutional momentum
📰 Strong sentiment and intermarket flows
Check your chart radar: Fundamentals + technicals aligning = green light for robbery! 🟢
⚠️ Tactical Reminder: News Can Jam the Plan
📵 Avoid new entries during major economic releases
🛡 Use trailing SLs to protect running trades
Stay alert, stay alive. 💡
❤️ Support the Robbery Crew
Hit that 💥BOOST💥 — your love fuels our next mission.
Join us and ride daily heist plans with Thief Trading Style 🏴☠️🚀💰