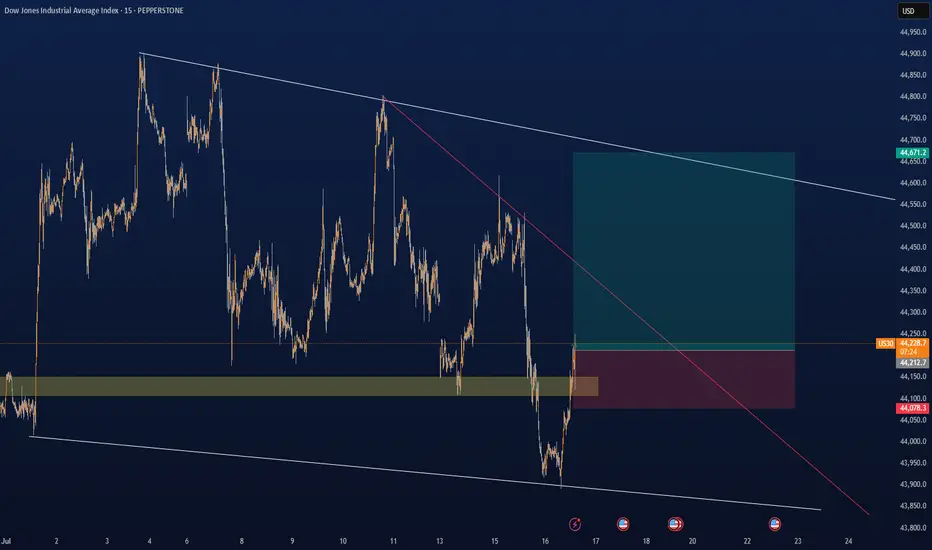
US30 Update – 07/22/2025📍 US30 Update – 07/22/2025
Still trapped in the range chop ⚠️
Price rejected off 44,611 again and is now pulling back toward mid-range. Structure continues to respect key zones, and we now see lower highs forming — early signs of bearish pressure building 🐻
EMA crossover is flipping bearish on the 1H — sellers gaining control short term.
📊 Market Structure:
📉 Lower highs forming below 44,611
📈 Still above demand at 44,171
📉 EMA 9/21 crossover down — bearish tilt
📉 Momentum weak under 44,385
🔑 Key Levels:
🔼 Resistance: 44,611 → 44,867
🔽 Support: 44,171 → 43,929
🧠 Market Bias:
Short-term bearish 🧨
➡️ Clean breakdown of 44,171 = bearish momentum
➡️ Buyers must reclaim 44,385 to shift bias
💡 Trade Scenarios:
📉 Bearish Rejection Play:
Entry: 44,380–44,400
TP1: 44,200
TP2: 44,000
SL: Above 44,430
📈 Demand Bounce (Low-Risk Buy):
Entry: 44,180–44,150
TP1: 44,385
TP2: 44,600
SL: Below 44,100
US30 trade ideas
US30: The Market Is Looking Down! Short!
My dear friends,
Today we will analyse US30 together☺️
The recent price action suggests a shift in mid-term momentum. A break below the current local range around 44,306.1 will confirm the new direction downwards with the target being the next key level of 44,263.8..and a reconvened placement of a stop-loss beyond the range.
❤️Sending you lots of Love and Hugs❤️

US30Given the current COT data, technical indicators, and economic factors, the bias for the US30 is bearish. Traders should monitor upcoming economic reports and Federal Reserve announcements for potential shifts in market sentiment.

US30Recent COT data shows rising net short positions on U.S. equity indices, reflecting bearish sentiment from institutional traders toward the Dow (US30). This indicates growing caution or expectations of downside pressure.

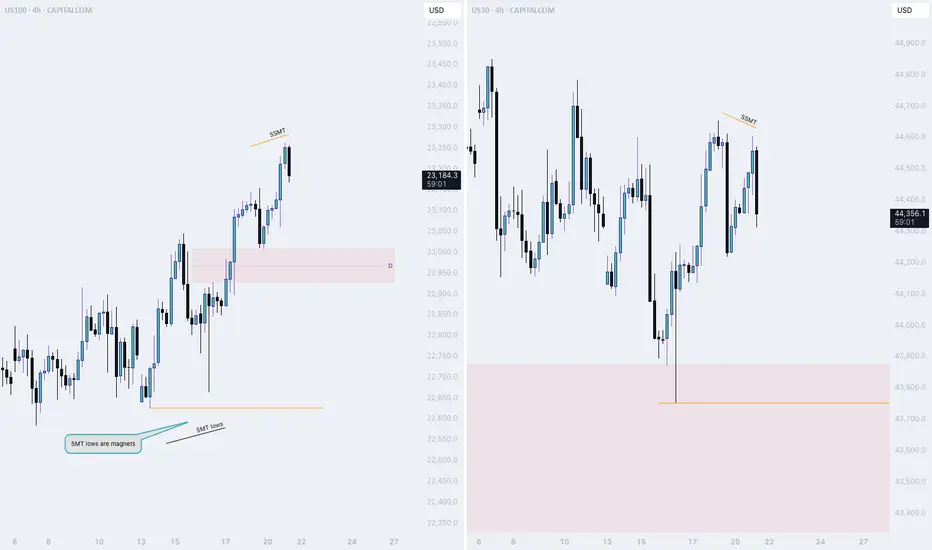
NQ thread: Short ideaMonday started off bullish, but only to drop at the end of the session.
Here is a thread on what is happening and on which narratives I view the market
Starting off with the 4H Time frame, we witnessed NQ and ES taking last weeks high.
YM did not.
This is the first stage of the movement. To find the second stage, we need to dive deeper into the lower timeframes..
US30 continues to exhibit bullish momentumThe US30 index continues to exhibit bullish momentum, driven by strong earnings reports and robust U.S. economic data. The key support zone around 44,300 has held firm, reinforcing confidence among buyers.
As long as the price remains above 44,300, the uptrend is expected to persist Upside target: 45,000 remains in focus. a focus on the 1H Candle close above 44,000 we could expect price could push more upside.
You may find more details in the chart Trade wisely best of luck buddies
Ps: Support with like and comments for better analysis Thanks for Supporting.

Possibility of uptrend It is expected that the triangle pattern will form according to the specified direction and then we will see the start of the upward trend. If the index breaks through the support area and consolidates, the continuation of the downward trend is likely.

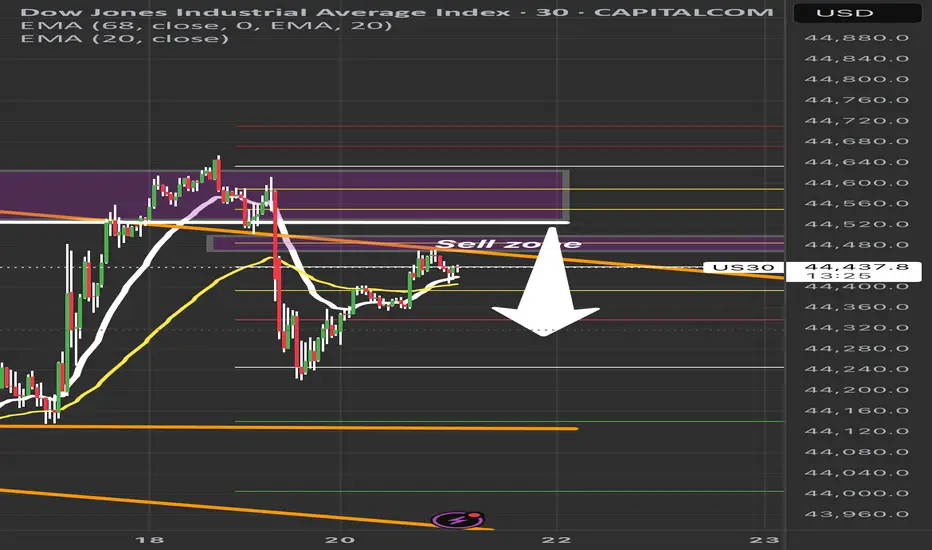
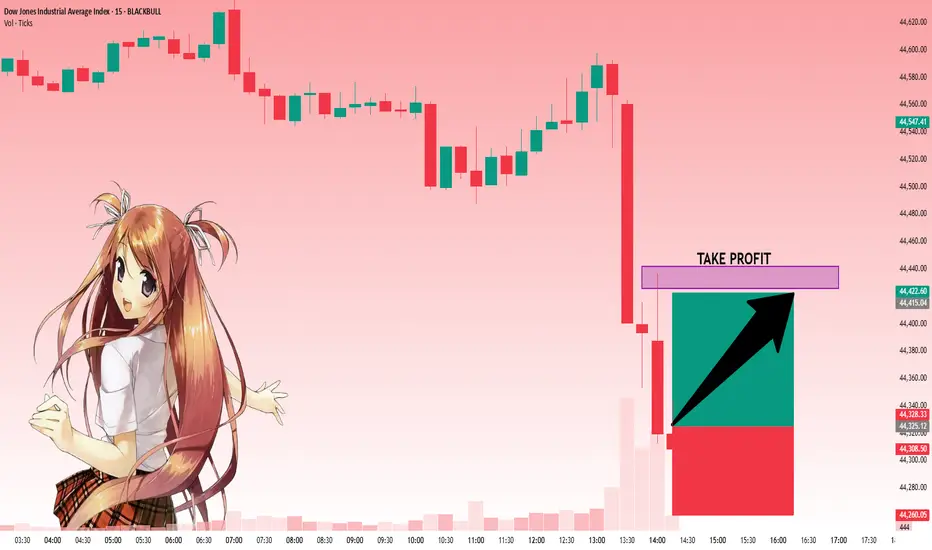
US30 Sell Setup – Watching Key Retracement ZonePrice is pulling back into a key sell zone (44,480–44,550) after a strong bearish move.
✅ Confluences:
• Previous liquidity zone
• 50–61.8% Fib retracement
• EMA rejection overhead
Plan: Waiting for bearish confirmation before short entry.
🎯 Targets:
TP1: 44,300
TP2: 44,150
TP3: 44,000
❌ Invalidation: Break above 44,600.
Patience = Precision. No confirmation, no trade.
#US30 #DowJones #TradingSetup #SmartMoneyConcepts #PriceAction #LiquidityZones #ForexTrading #DayTrading #IndicesTrading #SupplyAndDemand #TechnicalAnalysis #Fibonacci #MarketStructure #ScalpSetup #SwingTrade #RiskManagement #TradingEducation
Litty Like US30!!I'm purely going off the Week chart. 4hr MSS+ 4hr BPR gives me reasons to buy price. I'm targeting the Equal Highs on the Weekly chart.

Dow Jones is Nearing an Important Support!!Hey Traders, in today's trading session we are monitoring US30 for a buying opportunity around 43,950 zone, Dow Jones is trading in an uptrend and currently is in a correction phase in which it is approaching the trend at 43,950 support and resistance area.
Trade safe, Joe.

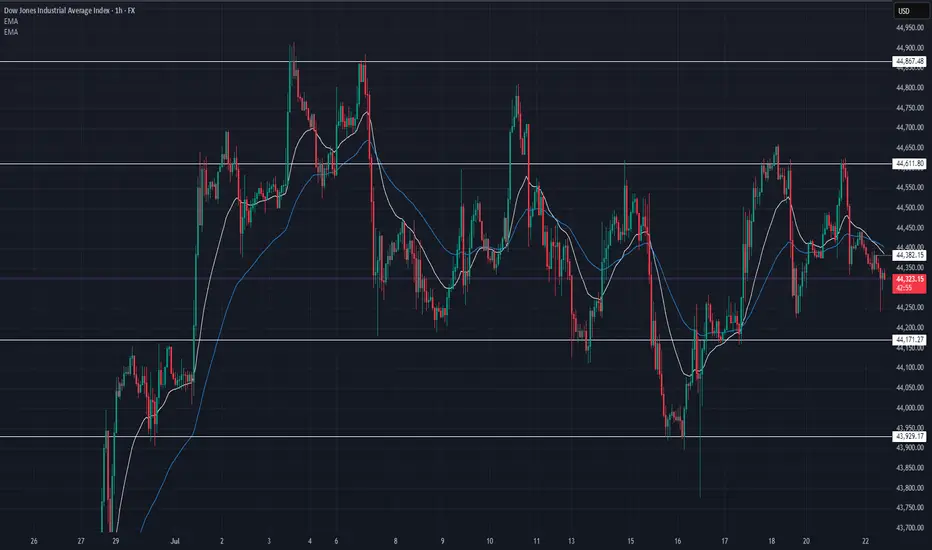
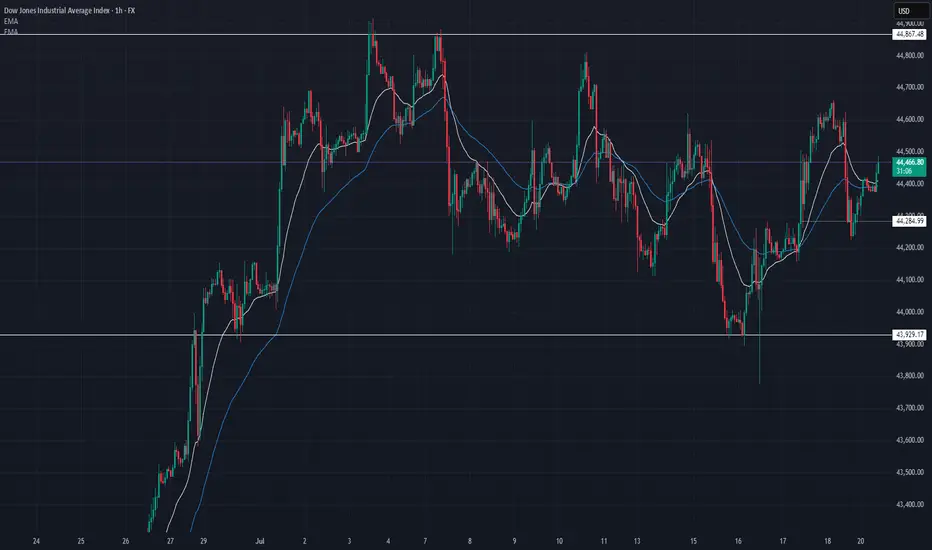
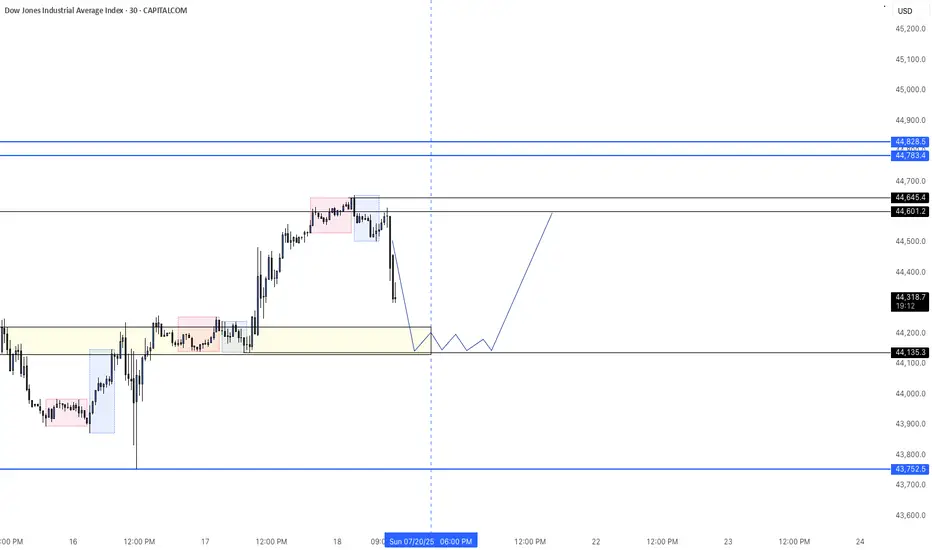
US30 Update – 07/21/2025📍 US30 Update – 07/21/2025
Sideways chop continues on US30 🌀
We’re still range-bound between 44,285 and 44,867, with price currently hovering mid-range around 44,470. Structure remains indecisive — buyers tried to push higher but got faded near the 44,600 level again.
EMA structure is flat on the 1H — confirmation that we’re consolidating.
📊 Market Structure:
🔄 Consolidation Zone: 44,285 → 44,867
📉 Failed to hold above 44,600
📈 Bulls defending 44,285 zone (demand still active)
📊 1H EMAs flat — neutral/slightly bullish
🔑 Key Levels:
🔼 Resistance: 44,600 → 44,867
🔽 Support: 44,285 → 43,929
🧠 Market Bias:
Neutral short term ⚖️
➡️ Clear breakout above 44,867 = trend continuation
⬇️ Breakdown below 44,285 = bearish structure confirmed
💡 Trade Scenarios:
📈 Range Buy (Support Play):
Entry: 44,300–44,285
TP1: 44,500
TP2: 44,700
SL: Below 44,200
📉 Range Sell (Resistance Fade):
Entry: 44,600–44,650
TP1: 44,400
TP2: 44,300
SL: Above 44,700
⚔️ Breakout Setup:
Long above 44,870 (confirmation)
Short below 44,280 with volume
📵 No trade in the middle of the range unless scalp — wait for edges to act.
US30 - Pattern & SMA PerspectiveDear Friends in Trading,
How I see it,
Pattern suggests there is room for more upside action.
1) SMA's are weaving - tight state - accumulation
2) As long as price respects the pattern a bullish breakout is likely.
Keynote:
A very healthy bull trend full of liquidity lies beneath this holding pattern
An unforeseen fundamental catalyst may force a correction at any time
I sincerely hope my point of view offers a valued insight.
Thank you for taking the time study my analysis.

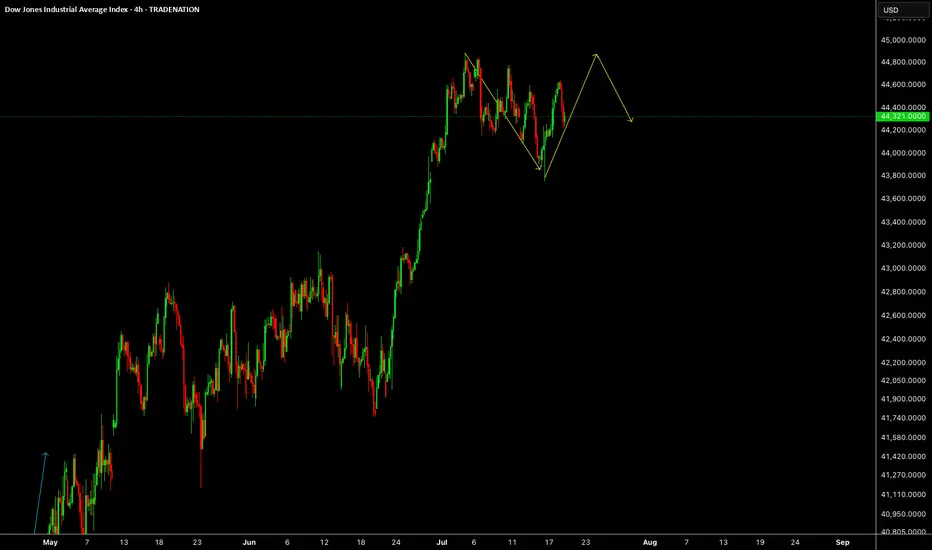
US30US30 needs some more correction, this week will be up and down both moves.
Disclosure: We are part of Trade Nation's Influencer program and receive a monthly fee for using their TradingView charts in our analysis.
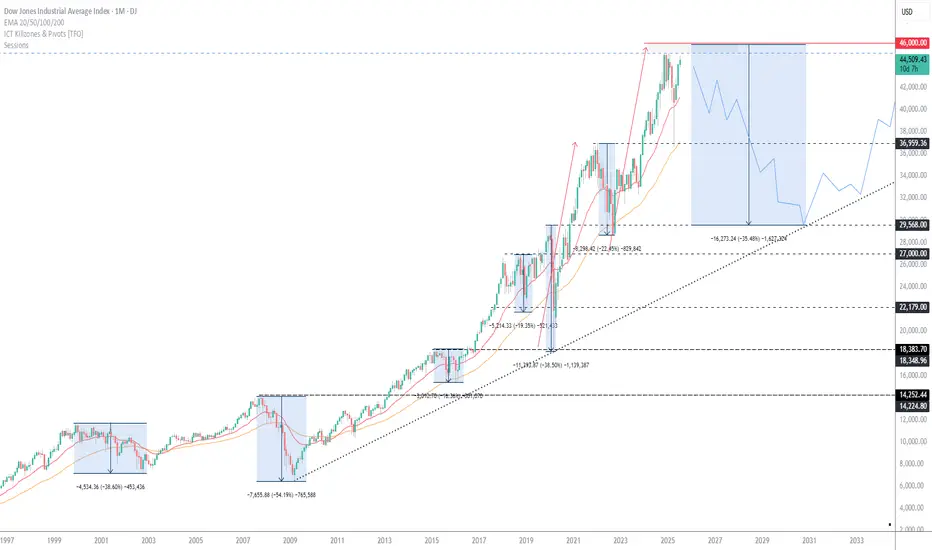
Dow Jones -> A breakout rally of +40%!🐂Dow Jones ( TVC:DJI ) will create new highs:
🔎Analysis summary:
Since the April lows, the Dow Jones already rallied about +25%. This was simply the expected rejection away from a strong confluence of support. Now, the Dow Jones is sitting at the previous all time highs and about to break out, leading to a massive rally.
📝Levels to watch:
$45.000, $60.000
🙏🏻#LONGTERMVISION
Philip - Swing Trader

US30 - LONGBearish Friday after price hit a key level high. Price will continue to the downside the remainder of today. Expecting a jump back to today's highs come Monday morning.
US30: Move Up Expected! Long!
My dear friends,
Today we will analyse US30 together☺️
The price is near a wide key level
and the pair is approaching a significant decision level of 44,325.14 Therefore, a strong bullish reaction here could determine the next move up.We will watch for a confirmation candle, and then target the next key level of 44,425.56.Recommend Stop-loss is beyond the current level.
❤️Sending you lots of Love and Hugs❤️
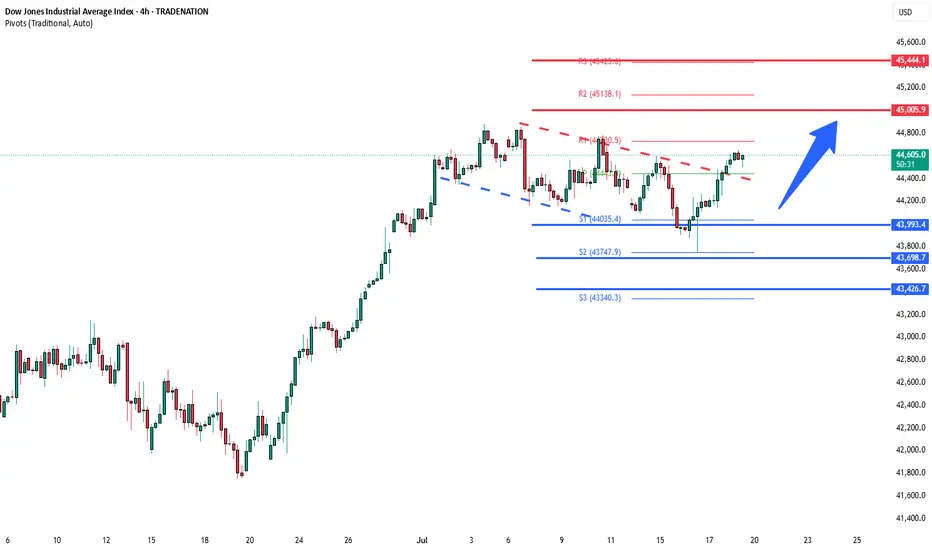
DowJones bullish continuation breakout support at 43990Key Support and Resistance Levels
Resistance Level 1: 45000
Resistance Level 2: 45440
Resistance Level 3: 46000
Support Level 1: 43990
Support Level 2: 43700
Support Level 3: 43420
This communication is for informational purposes only and should not be viewed as any form of recommendation as to a particular course of action or as investment advice. It is not intended as an offer or solicitation for the purchase or sale of any financial instrument or as an official confirmation of any transaction. Opinions, estimates and assumptions expressed herein are made as of the date of this communication and are subject to change without notice. This communication has been prepared based upon information, including market prices, data and other information, believed to be reliable; however, Trade Nation does not warrant its completeness or accuracy. All market prices and market data contained in or attached to this communication are indicative and subject to change without notice.
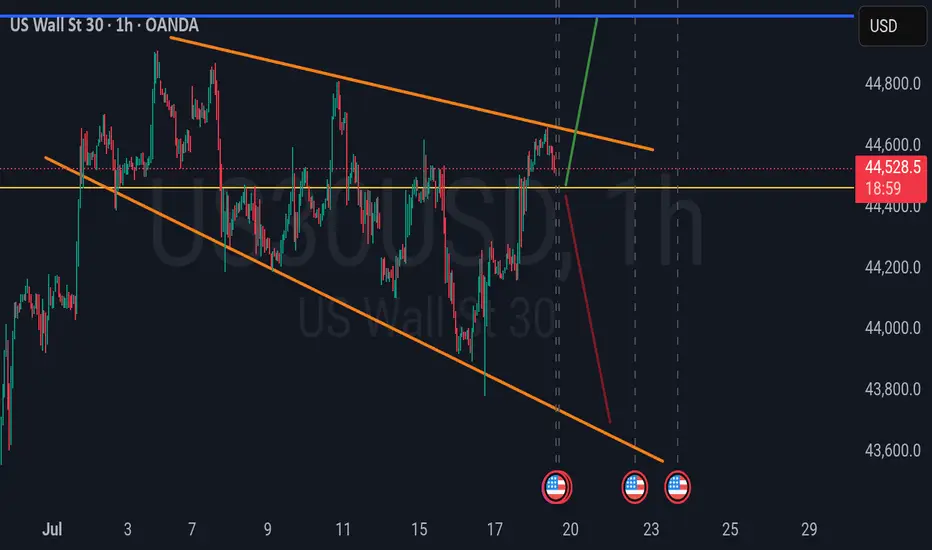
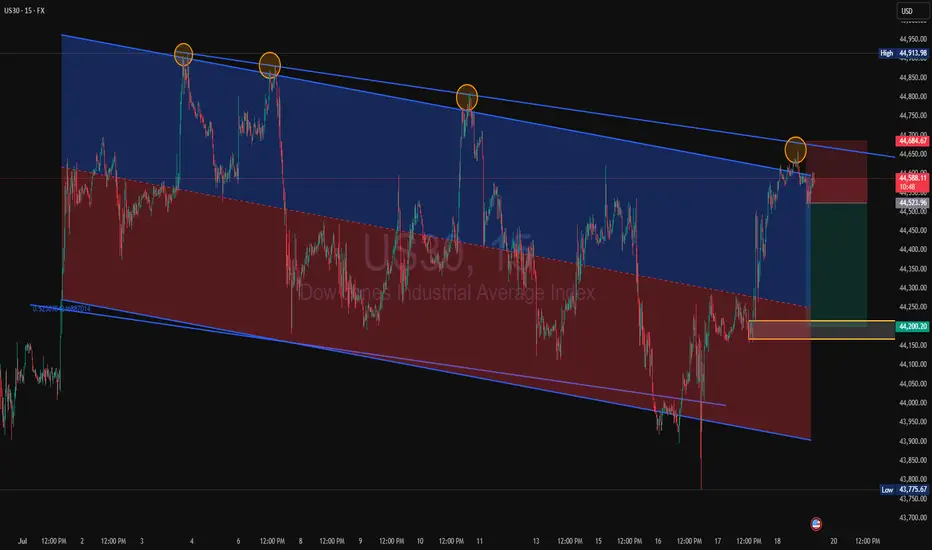
US30 Rejection at Channel Resistance US30 is showing a repeated pattern of rejection at the upper boundary of the descending channel. Price has now tapped this trendline for the fourth time, forming a consistent bearish structure.
Price rejected again at the top of the descending channel (marked by orange circles)
Clear sell setup with stop above the most recent swing high, targeting the lower channel boundary around 44,200, aligning with past demand.
Short below 44,685
Target: 44,200
Stop: Above recent highs near 44,913
Risk/Reward: Favourable if structure holds. If this pattern plays out as before, we can expect another push to the downside within the channel.
A break and retest of the midline could add extra confirmation.
#US30 #DowJones #PriceAction #SellSetup #BearishRejection #ChannelTrading #TechnicalAnalysis
EURUSD & US30 Trade Recaps 18.07.25A long position taken on FX:EURUSD for a breakeven, slightly higher in risk due to the reasons explained in the breakdown. Followed by a long on OANDA:US30USD that resulted in a loss due to the volatility spike that came in from Trump.
Full explanation as to why I executed on these positions and the management plan with both.
Any questions you have just drop them below 👇

US30 Holds Above 44500 – Bullish Momentum in PlayUS30 | Technical Overview
The price action continues to reflect a bullish bias, supported by strong earnings reports and solid U.S. economic data. As long as the index trades above 44500, the upward momentum is expected to continue.
Technical Outlook:
Price remains bullish above 44500, with upside targets at 44640 and 44760.
A confirmed 1H close below 44500 would shift momentum to the downside, exposing support levels at 44350 and 44215.
Key Levels:
• Pivot: 44500
• Resistance: 44640 / 44760 / 44920
• Support: 44350 / 44215 / 44075

US30 UNCERTAINTY We could see a possible bounce on 4465. or price could break below and target 43700