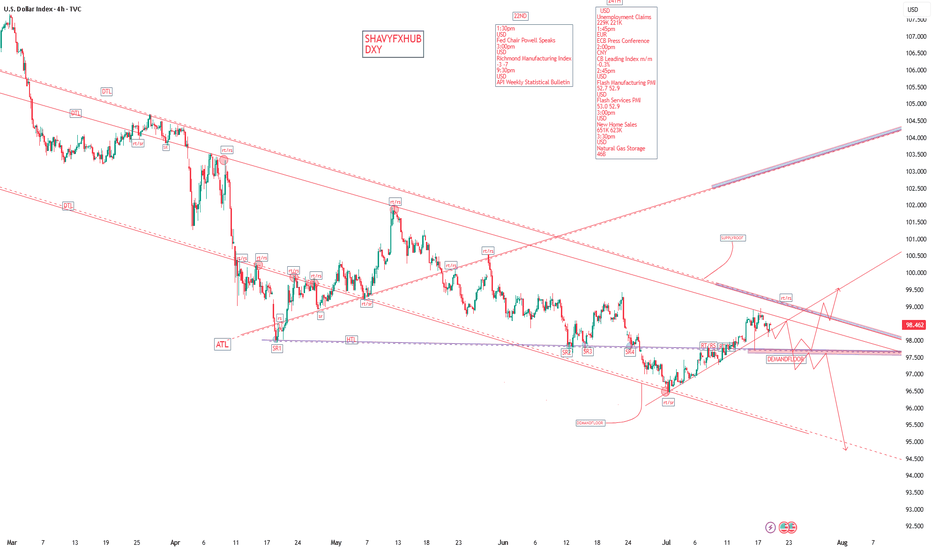
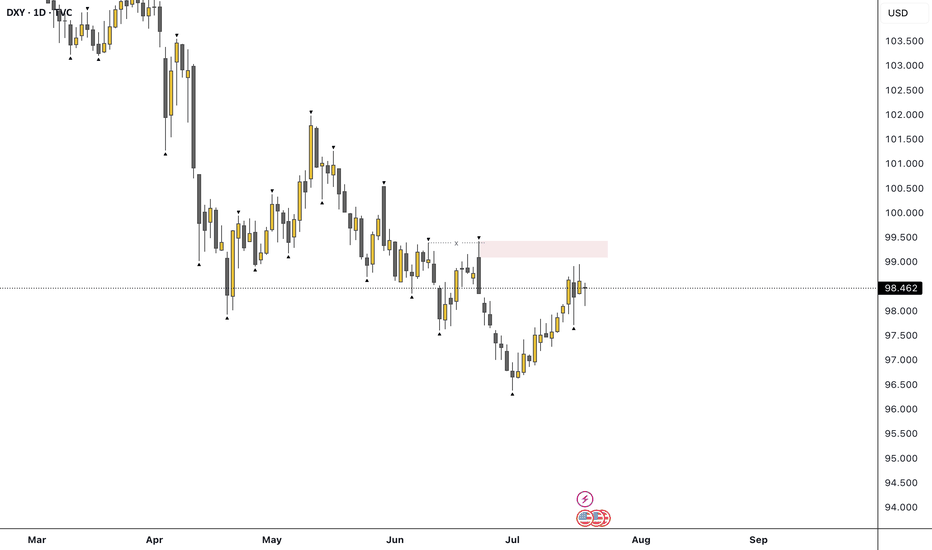
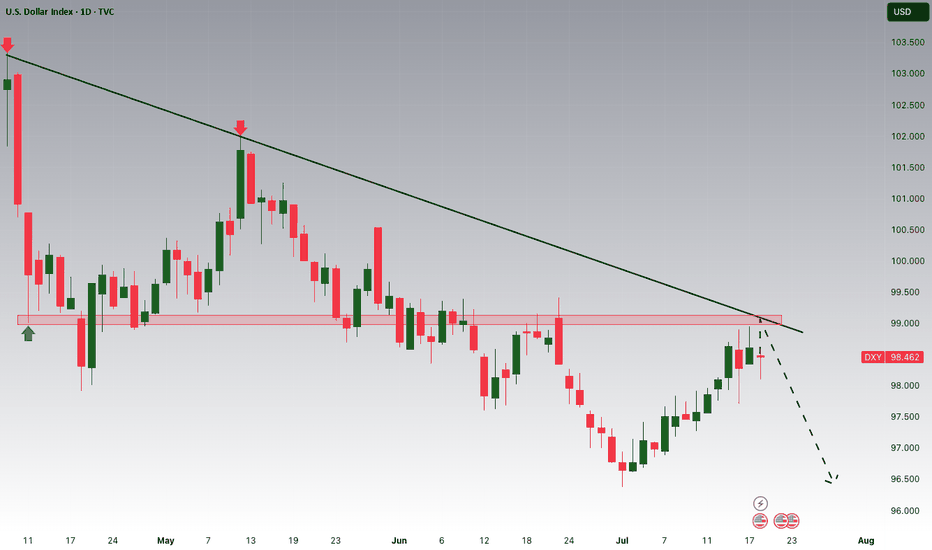
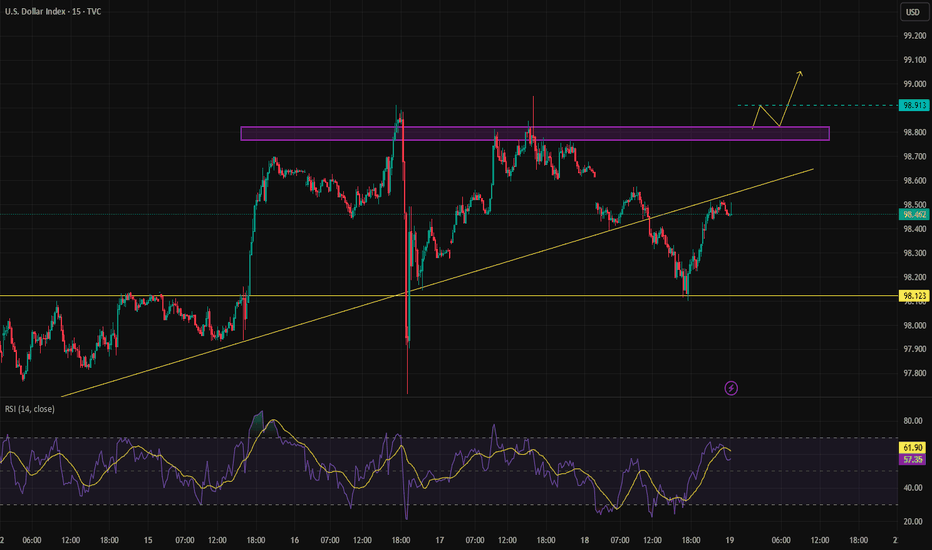
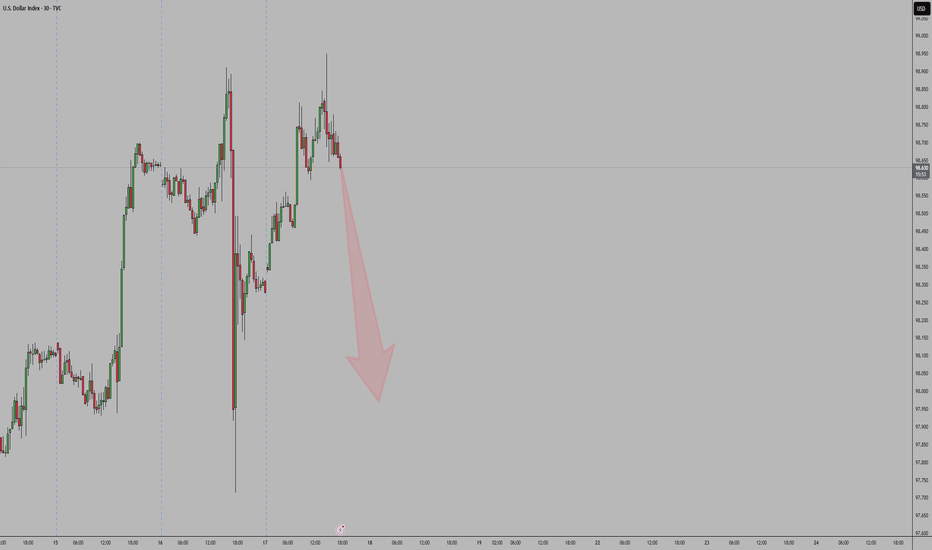
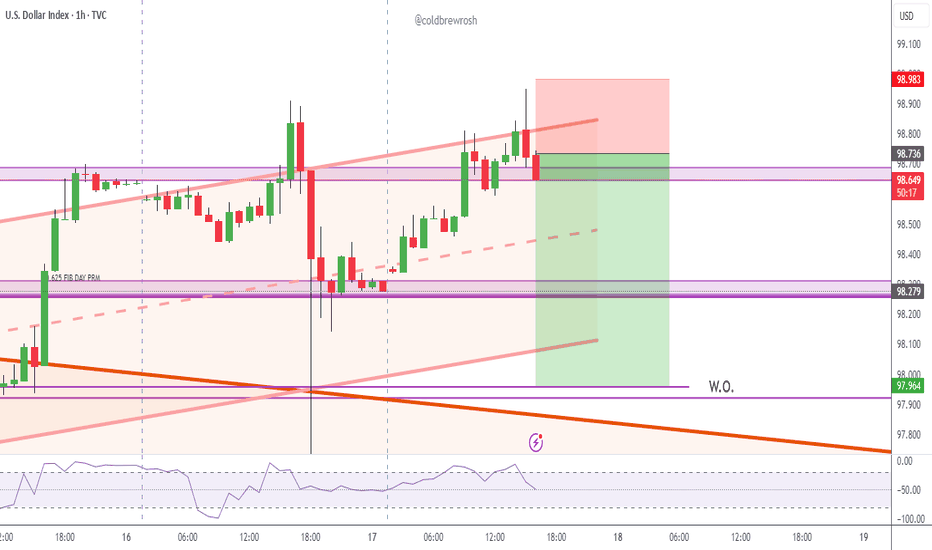
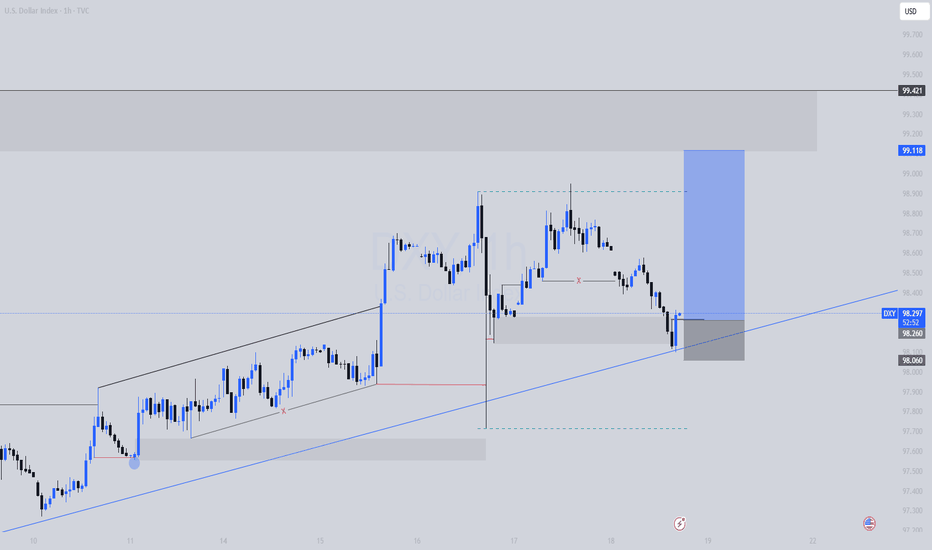
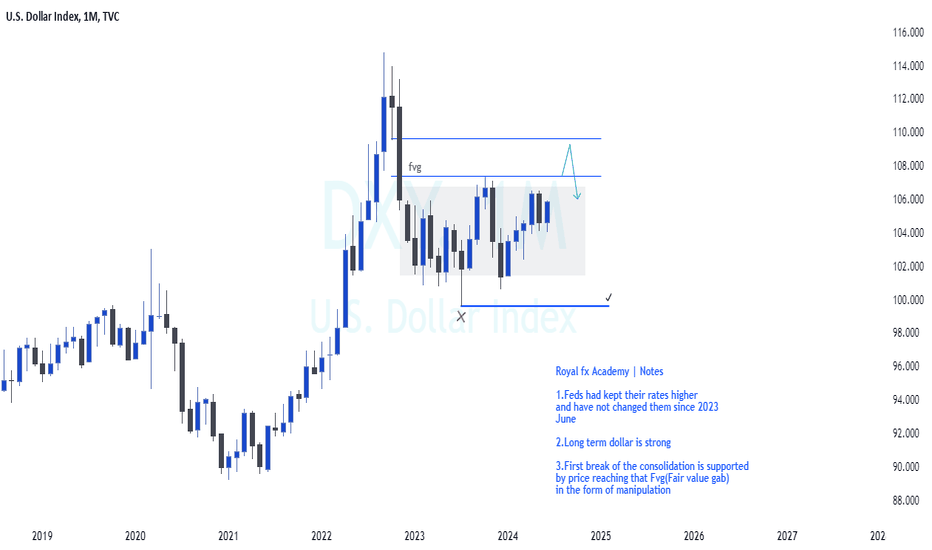
US DOLLAR INDEX (DXY): Important Bearish BreakoutThe DOLLAR INDEX has dropped below an important level of support and has now become a significant resistance. With the pair in a bearish trend, we can anticipate this downward movement to continue. The target price is 107.12.Longby linofx1119
DXY Rejection at Key Resistance – Potential Drop AheadThis chart of the U.S. Dollar Index (DXY) on the 4-hour timeframe shows a strong rejection from the highlighted resistance zone around 109.800–110.000. Key Observations: - Rejection at Resistance: Price attempted to break above but faced strong selling pressure, leading to a rejection. - Possible Downtrend Formation:** The price could now move lower, targeting the 1st target zone (~109.100–109.136) and potentially the **2nd target zone (~107.500–107.480)** if the bearish momentum continues. - Break of Structure (BoS) & Change of Character (ChoCh): The previous market structure shifts indicate potential reversals, supporting the idea of a bearish move. Conclusion: A pullback from resistance suggests a possible downside move. If price fails to reclaim the resistance zone, a sell-off towards the marked targets seems likely. Watch for confirmation near the 1st target to assess continuation or reversal.Shortby TRADE_CENTER_1Updated 6
Dollar Index (DXY): Recovery Continues Dollar Index may continue recovering today. A bullish breakout of a falling parallel channel on an hourly indicates a local strength of the buyers. Goals: 107.77 / 107.85 ❤️Please, support my work with like, thank you!❤️ Longby VasilyTrader1110
Levels discussed on Livestream 5th Feb 20255th Feb 2025 DXY: Trading lower, needs to break 107.50 to retest 107 round number support level. NZDUSD: Wait and look for reaction at 0.57 resistance area AUDUSD: Buy 0.6280 SL 25 TP 80 (hesitation at 0.6325) GBPUSD: Buy 1.2530 SL 30 TP 80 EURUSD: Sell 1.0440 SL 30 TP 100 USDJPY: Looking for reaction at current support level. Buy 154.10 or Sell 152.30 (SL 40 TP 120) EURJPY: Buy 160.10 SL 60 TP 120 GBPJPY: Nothing for now USDCHF: Downside to 0.8980, no H1 setup USDCAD: Sell 1.4280 SL 40 TP 150 XAUUSD: Hit my TP at 2865, could retrace to 2841 before trading higher again to maybe 2900by JinDao_Tai7
Could the dollar reaches 120 level again ?Debt as Robert Kiyosaki said can be a double edge sword. On a consumer level, if you have outstanding loan , say credit card debts , it is 24% per annum and paying the minimum would be disastrous. However, on a national level, the government has several tools to play around to minimise their debts. Thus far, I have not heard of any countries that are debt free. It seems as the economy gets better, the more debts the countries got itself into. The government debt for US is already in trillions and I believe Trump would be printing money soon! And the irony is with more US dollars floating in the market, should its currency not come tumbling down? After the Financial Crisis in 2009, the US dollar has never been stronger , riding on more than a decade of uptrend move. We must not forget the fact that the US dollars remain a "safe haven" asset to many and when inflation hits US, this would be an asset class that is going to be snap up by the institutions. Consumers in US would be paying higher price with the tariffs that other countries are imposing to counteract Trump's tariffs. Feds want to bring the inflation rate to 2% and at current rate of 2.89, it has quite a journey to travel. So , if the inflation rates continues to climb from 2.89, then the Feds will be force to increase its interest rates once more to cool down the economy. Very simple right ? With higher interest rates, consumers would want to hold more cash at bank to earn the interest and spend less, thus lowering the demand of goods and services and making the suppliers/sellers to reduce their price and thus lower inflation. Let's watch and see over the next few months on how the dollars performance will turn out . by dchua19690
DXY Trading JournalDXY Trading Journal Feb 6 Well I was wrong yesterday in my analysis. Why? I was following the premium to discount logic, and also so new that not seeing HTF institutions order flow. Feb 5 note "My logic says if price takes out the noted sell side liquidity it should react and seek the 50 level at 108,000, and yet it could just keep seeking lower prices."-yesterdays quote. Price lowered to below the 50 level wicked through the weekly BISI/volume imbalance from Jan 27 also coming to the .618. on the daily chart. The previous range is in a discount. I would suspect that Price could seek higher Prices to rebalance the hourly FVG and the equal highs. If price comes to the 107.775-107.820 for the London session and seek lower prices in NY. by LeanLena0
Could the price bounce from here?US Dollar Index (DXY) is falling towards the pivot which is an overlap support and could bounce to the pullback resistance. Pivot: 107.14 1st Support: 106.57 1st Resistance: 108.11 Risk Warning: Trading Forex and CFDs carries a high level of risk to your capital and you should only trade with money you can afford to lose. Trading Forex and CFDs may not be suitable for all investors, so please ensure that you fully understand the risks involved and seek independent advice if necessary. Disclaimer: The above opinions given constitute general market commentary, and do not constitute the opinion or advice of IC Markets or any form of personal or investment advice. Any opinions, news, research, analyses, prices, other information, or links to third-party sites contained on this website are provided on an "as-is" basis, are intended only to be informative, is not an advice nor a recommendation, nor research, or a record of our trading prices, or an offer of, or solicitation for a transaction in any financial instrument and thus should not be treated as such. The information provided does not involve any specific investment objectives, financial situation and needs of any specific person who may receive it. Please be aware, that past performance is not a reliable indicator of future performance and/or results. Past Performance or Forward-looking scenarios based upon the reasonable beliefs of the third-party provider are not a guarantee of future performance. Actual results may differ materially from those anticipated in forward-looking or past performance statements. IC Markets makes no representation or warranty and assumes no liability as to the accuracy or completeness of the information provided, nor any loss arising from any investment based on a recommendation, forecast or any information supplied by any third-party.Longby ICmarkets1111
DXY on the verge of a bearish reversal - The Trump EffectDXY has finally started to give bearish indications from HTF monthly supply and i think history is likely to repeat itself here, similar to trumps last term, where he wanted to weaken the dollar and is wanting to do the same again this term! With this in mind, the technicals are also aligning with this thesis as DXY looks more and more topped out as it hits crucial key levels and supply, giving breakdowns from the daily timeframes. Its gave a 1,2 and 3 day bearish MS, confirming the monthly supply with this bearish breakdown. From here I want to see continued downside momentum into a weekly bearish MS as marked up on the chart with a body close below this level to really give HTF confirmation of this HTF reversal from supply, leading to a full bearish reversal in DXY and a changed macro outlook as EU, GU, AU all flip bullish on their HTF, fuelling a continued bullish phase in BTC as DXY breaks down with their inverse correlation they hold. Id expect to see DXY target the SSL on the HTF range lows and come into HTF 6 month and 1 year demand ranges below this to act as key HTF reversal levels in the future. If we see the 1 weak bearish structure flip in DXY from here, its likely we start a new HTF downtrend in DXY for the foreseeable until it hits the SSL on the range lows as a minimum, which will result in a positive outlook for crypto. Trump has also publicly stated he wants to weaken the dollar and did so in his last term too, where the dollar pulled a HTF bearish reversal putting in the high and starting a bear trend for the following 400 days after his entrance to office as you can see on the chart. This only supports the HTF bearish reversal and thesis here and what im seeing on the charts! Weakening of the dollar results in many benefits to the USA and global economy: Trump's push for a weaker dollar boosts U.S. exports, reduces the trade deficit, and makes debt easier to manage by inflating it away. It also drives stock market growth and attracts foreign investment into U.S. assets. However, it risks higher inflation and weaker purchasing power. For crypto, a weaker dollar is typically bullish—investors seek alternative stores of value like Bitcoin and gold to hedge against currency devaluation. A falling USD also fuels liquidity into risk assets, driving higher speculation in crypto markets. If Trump weakens the dollar aggressively, BTC and alts could see significant upside. Shortby marshyyy2230
Greenback Today's ISM services led to profit taking in the dollar. Strong Us economic data is key in the coming months. interesting if we can break and retest above Jan 2, 2025, high of 109.40. On another front, the relative strength index is now beginning to cross below 50. failure to defend the 108 area would then depreciate to a price of 105.50, a major structural support zone, and this area is the bull's last line of defense. I am using the September 2024 low as my Fibonacci guide.Longby Rodswingfx4
DXY Risky Long! Buy! Hello,Traders! DXY has been making some Pretty wild moves on the Recent geopolitical news Lately so we need to be Trading this index with Caution, however, the Dollar index is approaching A horizontal support of 107.000 From where we will be Expecting a local Bullish correction Buy! Comment and subscribe to help us grow! Check out other forecasts below too! Longby TopTradingSignals113
Dollar index in a bullish daily channel, only doing correction?Drawing out our analysis from a daily time frame we can see the dollar index still in a clear rising uptrend channel. What we currently experiencing could be seen as a correction move after the steep bull move. If price respects the channel the dollar index could potentially see some bull rally soon. However, if it breaks the channel,then only my bias would change.Longby cloeteg64
Mighty DollarDxy on Friday saw a rejection of 105.40 with jobs report reading of 227k beating October print of -28k closing the week at 105.97 this area is interesting because of a higher low from rally on November 24. looking ahead cpi on Wednesday could provide fresh direction. capturing a move above 106.35 could approach Fibonacci retracement 0.618 at 107.05 and 0.706 Fibonacci at 107.27. Trade at your own risk. by RodswingfxUpdated 3360
Dollar Topped, Crypto BottomedEach cycle we've seen the same pattern in USD: Relentless rise, pops out of the range, traps bulls and slams them below the range over the subsequent ~1 yr. Each top in USD has coincided with a bottom in altcoins and kicked off altseason. Strap in...by ZenTradesRW5
DXY US Dollar Index Market Bearish Heist Plan🌟Hi! Hola! Ola! Bonjour! Hallo!🌟 Dear Money Makers & Robbers, 🤑 💰🐱👤 Based on 🔥Thief Trading style technical and fundamental analysis🔥, here is our master plan to heist the DXY US Dollar Index Market. Please adhere to the strategy I've outlined in the chart, which emphasizes short entry. Our aim is the high-risk Green Zone. Risky level, oversold market, consolidation, trend reversal, trap at the level where traders and bullish robbers are stronger. 🏆💸Be wealthy and safe trade.💪🏆🎉 Entry 📈 : "The vault is wide open! Swipe the Bullish loot at any price - the heist is on! however I advise placing Sell limit orders within a 15 or 30 minute timeframe. Entry from the most recent or closest high or low level should be in retest. Stop Loss 🛑: Thief SL placed at 108.500 (swing Trade) Using the 2H period, the recent / nearest low or high level. SL is based on your risk of the trade, lot size and how many multiple orders you have to take. Target 🎯: 106.000 (or) Escape Before the Target Scalpers, take note 👀 : only scalp on the Short side. If you have a lot of money, you can go straight away; if not, you can join swing traders and carry out the robbery plan. Use trailing SL to safeguard your money 💰. 📰🗞️Fundamental, Macro, COT, Sentimental Outlook: DXY US Dollar Index Market is currently experiencing a Bearish trend., driven by several key factors. 🟦Fundamental Analysis: - The US Dollar Index (DXY) has been under pressure due to the contraction in JOLTS job openings, indicating a tightening job market - The Federal Reserve's monetary policies, geopolitical stability, and global acceptance of the dollar as a reserve currency contribute to the dollar's strength - A strong economy with high productivity, low unemployment, and stable inflation provides a foundation for strengthening the dollar's position 🟫Macro Analysis: - The US economy is expected to remain strong, with low unemployment and stable inflation, supporting the dollar's value - Global trade tensions and geopolitical instability may impact the dollar's value, but its status as a reserve currency provides stability - Interest rate decisions by the Federal Reserve will influence the dollar's value, with potential rate cuts impacting its strength 🟪Sentimental Analysis: - 60% of client accounts on IG are long on the US Dollar Index, indicating a bullish sentiment - However, the recent contraction in JOLTS job openings and potential Fed rate cuts may lead to a bearish sentiment 🟧COT Analysis: - The latest Commitment of Traders (COT) report shows that speculators are net long on the US Dollar Index, indicating a bullish sentiment - However, the report also shows that commercial traders are net short, indicating a potential bearish sentiment 🟨Positioning: - Corporate traders may consider hedging their exposure to the US Dollar Index due to potential volatility - Investor and hedge fund traders may consider going long on the US Dollar Index due to its potential strength, but should be cautious of potential rate cuts and geopolitical instability - Institutional traders may consider diversifying their portfolios to minimize exposure to the US Dollar Index - Retail traders should exercise caution when trading the US Dollar Index due to its potential volatility and should consider using proper risk management strategies ⚠️Trading Alert : News Releases and Position Management 📰 🗞️ 🚫🚏 As a reminder, news releases can have a significant impact on market prices and volatility. To minimize potential losses and protect your running positions, we recommend the following: Avoid taking new trades during news releases Use trailing stop-loss orders to protect your running positions and lock in profits 📌Please note that this is a general analysis and not personalized investment advice. It's essential to consider your own risk tolerance and market analysis before making any investment decisions. 📌Keep in mind that these factors can change rapidly, and it's essential to stay up-to-date with market developments and adjust your analysis accordingly. 💖Supporting our robbery plan will enable us to effortlessly make and steal money 💰💵 Tell your friends, Colleagues and family to follow, like, and share. Boost the strength of our robbery team. Every day in this market make money with ease by using the Thief Trading Style.🏆💪🤝❤️🎉🚀 I'll see you soon with another heist plan, so stay tuned 🤑🐱👤🤗🤩Shortby Thief_TraderUpdated 2
DXY Will Go Up From Support! Long! Please, check our technical outlook for DXY. Time Frame: 1D Current Trend: Bullish Sentiment: Oversold (based on 7-period RSI) Forecast: Bullish The market is on a crucial zone of demand 107.486. The oversold market condition in a combination with key structure gives us a relatively strong bullish signal with goal 108.791 level. P.S Please, note that an oversold/overbought condition can last for a long time, and therefore being oversold/overbought doesn't mean a price rally will come soon, or at all. Like and subscribe and comment my ideas if you enjoy them!Longby SignalProvider115
DXY Trading JournalDXY Trading Journal Feb 5 Price actions wild rally on Sunday to swipe the buy side and then has been energetic to rebalance the damage. Yesterday Price had a run on stops and rebalanced recent inefficiencies, in a distribution cycle. Price rebalanced Sundays and Mondays inefficiencies. Price is in Premium on W, and Daily chart coming to the 50 level and is still rebalancing a HTF Weekly SIBI. The range Price is trading in seems to be in deep discount just below the .70 level. Equal lows sell side and volume imbalance could be the magnet if price seeks lower prices. I would say for the day Price is in a double discount. Asia has opened in a discount on the range and energetically came to the 50 and lowered and for the moment continuing its seeking of lower prices. My logic says if price takes out the noted sell side liquidity it should react and seek the 50 level at 108,000, and yet it could just keep seeking lower prices. Non farm payroll week with PMI today in NY session. Follow your rules, stay out unless your complete model lines up. by LeanLena1
The Stablecoin Revolution: Is the Dollar's Reign Over? The Future of the Global Cryptocurrency Market: Navigating the Rise of Stablecoins and the Shifting Sands of Global Finance The cryptocurrency market has exploded in popularity over the past decade, evolving from a niche interest to a global phenomenon. While Bitcoin remains the dominant player, the landscape is rapidly diversifying, with stablecoins like USDC and Tether playing an increasingly crucial role. This article explores the future of the global cryptocurrency market, examining the growing influence of stablecoins and their potential impact on the traditional financial system, particularly in relation to the US dollar and the DXY index. The Rise of Stablecoins: Bridging the Gap Between Crypto and Fiat Stablecoins are cryptocurrencies designed to maintain a stable value, typically pegged to a fiat currency like the US dollar. This stability makes them attractive for everyday transactions and as a safe haven within the volatile crypto market. USDC and Tether are the two largest stablecoins, with market capitalizations in the tens of billions of dollars. The appeal of stablecoins lies in their ability to combine the benefits of cryptocurrencies – such as speed, low transaction costs, and 24/7 availability – with the stability of traditional currencies. This makes them ideal for a variety of use cases, including: • Remittances: Sending money across borders using stablecoins can be faster and cheaper than traditional methods. • Payments: Stablecoins can be used for everyday purchases, both online and in physical stores. • Trading: Stablecoins provide a stable asset for traders to use when navigating the volatile cryptocurrency market. • Decentralized Finance (DeFi): Stablecoins are a key component of DeFi protocols, where they are used for lending, borrowing, and trading. The Impact on the US Dollar and the DXY Index The growing adoption of stablecoins has raised questions about their potential impact on the US dollar and the DXY index, which measures the dollar's strength against a basket of other major currencies. Some analysts believe that the widespread use of stablecoins could weaken the dollar's dominance in global trade and finance. However, it's important to note that most stablecoins are currently pegged to the US dollar. This means that their value is directly tied to the dollar's performance. As a result, the rise of stablecoins could actually strengthen the dollar's position in the short term. In the long run, the impact of stablecoins on the dollar will depend on several factors, including: • Regulation: Governments around the world are beginning to pay close attention to stablecoins. The regulatory frameworks that are developed will play a significant role in shaping the future of these digital assets. • Adoption: The widespread adoption of stablecoins will be a key factor in determining their impact on the dollar. If stablecoins become a major force in global finance, they could challenge the dollar's dominance. • Competition: The emergence of other stablecoins pegged to different currencies, or even central bank digital currencies (CBDCs), could reduce the reliance on dollar-pegged stablecoins. Opportunities and Challenges in the Cryptocurrency Market The future of the cryptocurrency market is full of opportunities and challenges. The continued growth of stablecoins is likely to play a significant role in shaping this future. Other key trends to watch include: • Institutional adoption: More and more institutional investors are entering the cryptocurrency market. This is bringing increased legitimacy and liquidity to the market. • Technological innovation: The cryptocurrency market is constantly evolving, with new technologies and applications being developed all the time. This innovation is driving the growth of the market. • Regulatory clarity: As governments around the world develop clearer regulatory frameworks for cryptocurrencies, this will help to reduce uncertainty and encourage further adoption. However, there are also challenges that the cryptocurrency market must overcome, including: • Volatility: The cryptocurrency market remains highly volatile, which can make it risky for investors. • Security: There have been a number of high-profile hacks and scams in the cryptocurrency market, which have raised concerns about security. • Environmental concerns: The energy consumption of some cryptocurrencies, such as Bitcoin, has raised concerns about their environmental impact. Conclusion The future of the global cryptocurrency market is bright, with stablecoins playing an increasingly important role. While the impact on the US dollar and the DXY index remains to be seen, it's clear that stablecoins are changing the landscape of global finance. As the market continues to evolve, it will be important to keep an eye on the latest developments and to be aware of the opportunities and challenges that lie ahead. by bryandowningqln0
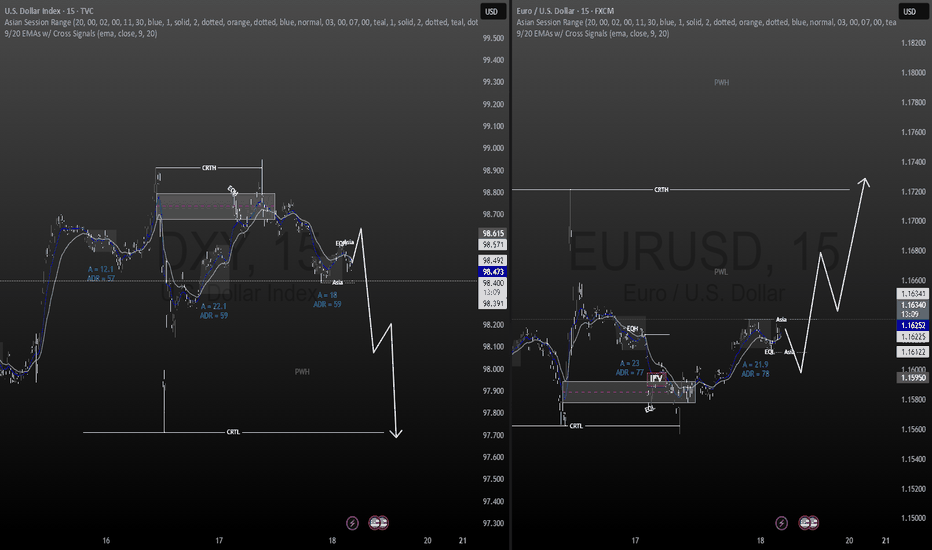
DXY update#DXY made a super rise 2 days ago due EUR drop ! this super rise made a huge gap in EURUSD chart and also DXY chart its self ! the gaps are filled and now we can see the main trend which is a remaining down spike in DXY it can make the next rise whenever hit the demand zone Shortby stratus_co3
Bullish bounce?US Dollar Index (DXY) is falling towards the pivot which has been identified as a pullback support and could bounce to the 1st resistance. Pivot: 107.57 1st Support: 106.51 1st Resistance: 108.79 Risk Warning: Trading Forex and CFDs carries a high level of risk to your capital and you should only trade with money you can afford to lose. Trading Forex and CFDs may not be suitable for all investors, so please ensure that you fully understand the risks involved and seek independent advice if necessary. Disclaimer: The above opinions given constitute general market commentary, and do not constitute the opinion or advice of IC Markets or any form of personal or investment advice. Any opinions, news, research, analyses, prices, other information, or links to third-party sites contained on this website are provided on an "as-is" basis, are intended only to be informative, is not an advice nor a recommendation, nor research, or a record of our trading prices, or an offer of, or solicitation for a transaction in any financial instrument and thus should not be treated as such. The information provided does not involve any specific investment objectives, financial situation and needs of any specific person who may receive it. Please be aware, that past performance is not a reliable indicator of future performance and/or results. Past Performance or Forward-looking scenarios based upon the reasonable beliefs of the third-party provider are not a guarantee of future performance. Actual results may differ materially from those anticipated in forward-looking or past performance statements. IC Markets makes no representation or warranty and assumes no liability as to the accuracy or completeness of the information provided, nor any loss arising from any investment based on a recommendation, forecast or any information supplied by any third-party.Longby ICmarkets4
DXY downtime (DROP YOU B*****D)Clear breakdown and backtest of bearish whatever da hell it is LFG!!!Shortby mypostsareNotFinancialAdvice0
Is the Dollar Index (DXY) Rolling Over?Chart Analysis: The U.S. Dollar Index (DXY) has pulled back from its recent highs after testing the 110.00 resistance level. The index remains within an established upward channel, but the latest price action suggests a short-term loss of momentum. 1️⃣ Uptrend Intact but Testing Support: The index has been trading within a rising channel (highlighted in green). Recent price action shows a rejection near 110.00, with a sharp pullback testing the lower boundary of the channel. 2️⃣ Moving Averages as Key Support: 50-day SMA (blue): Currently at 107.76, acting as dynamic support. 200-day SMA (red): Trending at 104.80, confirming a longer-term bullish structure. 3️⃣ Momentum Indicators Show Weakness: RSI: At 47.53, below the neutral 50 level, indicating fading bullish momentum. MACD: Slightly positive but showing signs of flattening, suggesting a potential slowdown in upside momentum. What to Watch: A break below 107.50 could accelerate selling pressure, leading to a deeper retracement. Holding above the 50-day SMA may support a rebound attempt toward 110.00 resistance. A confirmed breakout above 110.00 would reinforce bullish continuation, while failure to reclaim the highs may lead to further downside testing. The U.S. Dollar Index remains within a bullish structure, but the recent rejection at resistance calls for caution. Traders should monitor price action around key support levels to gauge the next move. -MWby FOREXcom6
DXY - "Pullback or Breakdown? Key Levels to Watch!"📉 Price Action Update: Key Levels to Watch Currently, the price is trading within the 108 – 107.800 range. There are two potential scenarios to anticipate: 1️⃣ If the price continues to decline, we could see a drop toward 106.950. 2️⃣ Alternatively, a pullback from 108 could push the price toward 108.500 – 108.700 before resuming its downside move. This analysis is based on DXY's price action on February 3rd, where it faced monthly timeframe resistance. Such a significant resistance level often leads to a short-term downtrend, especially on lower timeframes like the 1-hour chart. 📊 Stay alert to price reactions at these key levels! 🚀 Shortby Jimmy_Rebello441
DXY : Reaching for the skyThe chart above explains. My charts are straightforward. So there isn't much to talk about. But TV insist that I write something or else it would not publish. TV also offers me many 'trading tools' - of course, I have to pay. But the thing is that I have no use for such tools. So in the end, I use it for FREE Thank you TV.Longby i_am_siew4