Dollar Index AnalysisDollar Index has been in continuous sell for last 5 Months. Has hit the demand zone and giving a pull back and short term trend in daily and 4H charts. From the 4H charts we can see that it is in short term uptrend move and has pushed higher and it is giving a pull back which is visible.
USDINDEX trade ideas

US dollar RSI divergence on the weekly TFWeekly RSI div right into weekly demand. Likely the dollar finds a bottom here

DXY Holds Above Channel Support: Next Leg Higher?Hey Traders,
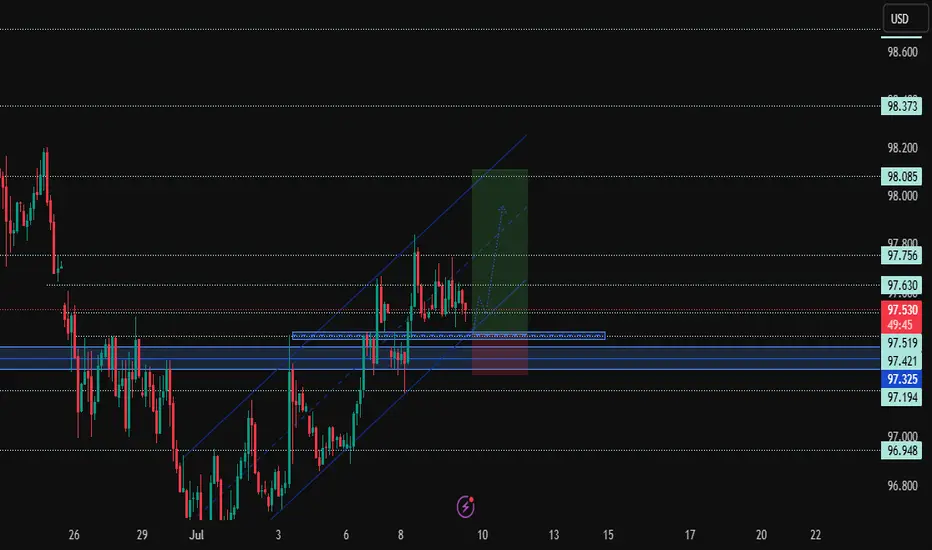
The U.S. Dollar Index (DXY) is consolidating just above a strong support cluster around 97.325, aligned with ascending channel structure and historical demand. Price action is suggesting a potential bullish continuation if this support zone holds firm.
Current Market Conditions:
* DXY is trading within a well-defined ascending channel, maintaining higher highs and higher lows.
* Price is currently hovering above the 97.325 key support area and mid-channel dynamic trendline.
* Recent candles show rejection from the lower boundary of the bullish channel, indicating buyers may be stepping in again.
* Structure remains bullish unless price closes decisively below 97.325.
Fundamental Analysis/Outlook:
The dollar remains buoyed by persistent inflation pressures and Fed Chair Powell’s continued hawkish tone. Markets are pricing in fewer rate cuts in the near term, reinforcing USD strength. Today’s USD resilience is also supported by mild risk-off sentiment ahead of U.S. CPI data and Powell’s congressional testimony, which could further move the greenback.
Targets:
* TP1: 97.756
* TP2: 98.085
* TP3: 98.373
Risk Management:
* Stop-loss: Below 97.325 to invalidate bullish structure.
* Risk-to-Reward (R\:R): Minimum 1:2 setup. Consider adjusting position size based on support behaviour and macro event volatility.
Technical Outlook:
* Price needs to hold above 97.421–97.325 zone to maintain bullish bias.
* Watch for bullish engulfing or momentum candles as confirmation for long setups.
* A break above 97.630 could accelerate the rally toward higher resistance at 98.373.
Conclusion:
DXY is at a decision point. If bulls maintain control above 97.325, the index could push higher toward the 98.00+ zone. Keep an eye on U.S. economic data and Fed commentary for directional confirmation.
Sign-off:
“In markets, clarity often lies just beyond the fear. Trade the levels, not the noise.”
💬 Let me know your thoughts in the comments, and don’t forget to boost and follow for more insights. Trade safe!
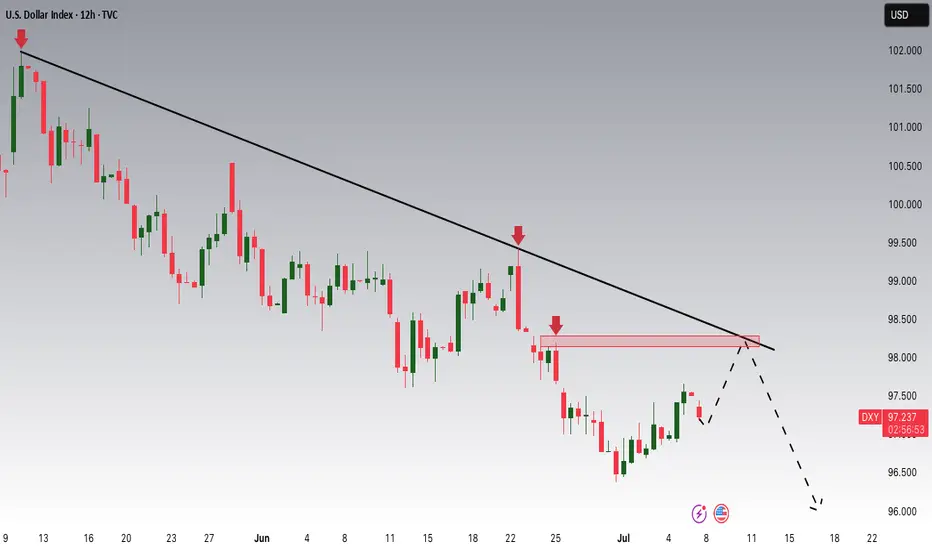
DXY Potential DownsidesHey Traders, in today's trading session we are monitoring DXY for a selling opportunity around 98 zone, DXY is trading in a downtrend and currently is in a correction phase in which it is approaching the trend at 98 support and resistance area.
Trade safe, Joe.

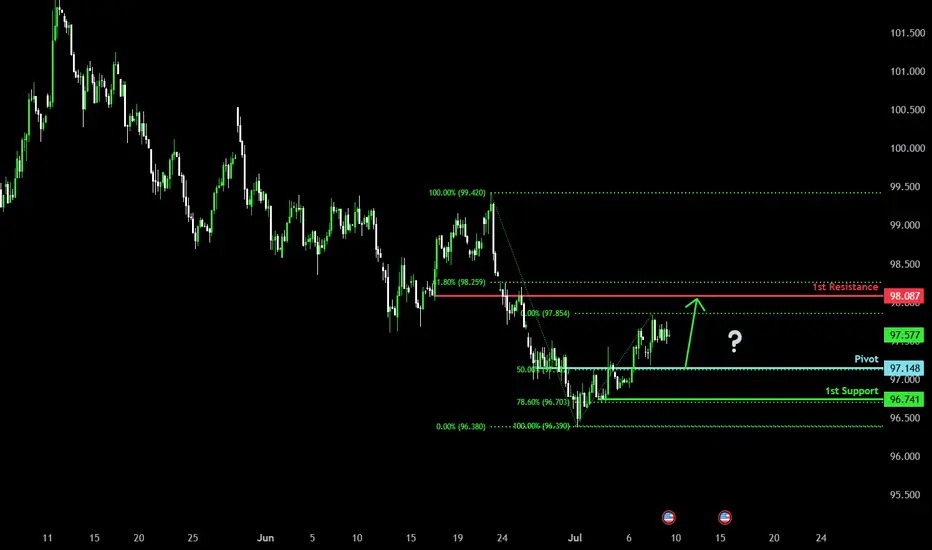
Bullish bounce off major support?US Dollar Index (DXY) is falling towards the pivot which has been identified as an overlap support and could bounce to the 1st resistance.
Pivot: 97.14
1st Support: 96.74
1st Resistance: 98.08
Risk Warning:
Trading Forex and CFDs carries a high level of risk to your capital and you should only trade with money you can afford to lose. Trading Forex and CFDs may not be suitable for all investors, so please ensure that you fully understand the risks involved and seek independent advice if necessary.
Disclaimer:
The above opinions given constitute general market commentary, and do not constitute the opinion or advice of IC Markets or any form of personal or investment advice.
Any opinions, news, research, analyses, prices, other information, or links to third-party sites contained on this website are provided on an "as-is" basis, are intended only to be informative, is not an advice nor a recommendation, nor research, or a record of our trading prices, or an offer of, or solicitation for a transaction in any financial instrument and thus should not be treated as such. The information provided does not involve any specific investment objectives, financial situation and needs of any specific person who may receive it. Please be aware, that past performance is not a reliable indicator of future performance and/or results. Past Performance or Forward-looking scenarios based upon the reasonable beliefs of the third-party provider are not a guarantee of future performance. Actual results may differ materially from those anticipated in forward-looking or past performance statements. IC Markets makes no representation or warranty and assumes no liability as to the accuracy or completeness of the information provided, nor any loss arising from any investment based on a recommendation, forecast or any information supplied by any third-party.
DXY: The Market Is Looking Down! Short!
My dear friends,
Today we will analyse DXY together☺️
The in-trend continuation seems likely as the current long-term trend appears to be strong, and price is holding below a key level of 97.054 So a bearish continuation seems plausible, targeting the next low. We should enter on confirmation, and place a stop-loss beyond the recent swing level.
❤️Sending you lots of Love and Hugs❤️

DXY Bearish Trend ContinuesThe overall trend is still bearish. Confirmation to short is on breakout and retest of the bearish continuation pattern. Short term targets are in H4 and Daily demand zones and long term target is the weekly demand zone.

possibility of uptrendThe bullish pattern is expected to advance along the specified path to the specified resistance levels. Then there is a possibility of a trend change.
If the support area is broken, the continuation of the downward trend is likely.

DOLLAR MONTHLYTHE monthly chart of dollar index reflect the economic health of the united states and the strength of the us dollar .
its key and critical to the direction and trade directional bias of AUDUSD,USDJPY,EURUSD,GBPUSD,USDZAR NZDUSD,USDCAD.
if this monthly chart is true expect a reversal on all the mentioned pairs.
GOLD could be exception as a top tier asset and store of value .
#dxy #dollar

DXY DOLLAR INDEX The DXY has declined from its current high 114.54 to 96.59 reflecting a weaker dollar against a basket of major currencies including the euro, yen, pound, Canadian dollar, Swedish krona, and Swiss franc.
Despite this decline, the dollar remains supported by strong US economic growth and higher US 10-year bond yields, which have widened the yield gap with other developed economies .
The Federal Reserve’s monetary policy has been relatively hawkish, with fewer rate cuts priced in compared to other central banks, helping to underpin the dollar.
Trade tensions and tariff uncertainties continue to create volatility, but the dollar benefits from safe-haven demand amid global uncertainties
Composition of the DXY Basket:
Euro (EUR): 57.6%
Japanese Yen (JPY): 13.6%
British Pound (GBP): 11.9%
Canadian Dollar (CAD): 9.1%
Swedish Krona (SEK): 4.2%
Swiss Franc (CHF): 3.6%
context
Drivers: US economic strength, Fed policy, bond yield differentials, trade tensions, and safe-haven flows keeping dollar on support hold.
Ongoing US tariff announcements and trade policy changes have contributed to volatility and risk aversion, pressuring the dollar lower.
US Economic Policy the Market is concerned about fiscal policy, Federal Reserve independence, and rising US debt which have led to reduced demand for US assets, further weighing on the dollar.
Interest Rate Differential:
The US Fed funds rate remains at 4.50%-4.25%, but with global central banks adjusting policy, the relative appeal of the dollar has diminished.
Conversely, a sustained move above 98.00 could signal a reversal and renewed dollar strength.
hope we can get back to 100 aagin.
#dollar

DXY - to provide short term bounce here DXY to bounce off key double confluence here to $100 before collapsing

DXY Bearish Setup
Entry: 97.50 (current price)
Target (TP): 96.500 or below
Stop Loss (SL): ~97.80 (above recent swing high or resistance)
Risk Management: Essential — position size based on SL distance and account size
🔍 Trade Rationale:
Technical View: Price may be forming a lower high, suggesting possible downside continuation.
Fundamental Pressure:
Market cautious on Fed rate path
Tariff uncertainty could weaken USD
Upcoming FOMC minutes may add pressure if dovish signals emerge

Could the price reverse from here?The US Dollar Index (DXY) is rising towards the pivot, which has been identified as a pullback resistance that aligns with the 50% Fibonacci retracement and could drop to the 1st support.
Pivot: 97.90
1st Support: 96.74
1st Resistance: 98.67
Risk Warning:
Trading Forex and CFDs carries a high level of risk to your capital and you should only trade with money you can afford to lose. Trading Forex and CFDs may not be suitable for all investors, so please ensure that you fully understand the risks involved and seek independent advice if necessary.
Disclaimer:
The above opinions given constitute general market commentary, and do not constitute the opinion or advice of IC Markets or any form of personal or investment advice.
Any opinions, news, research, analyses, prices, other information, or links to third-party sites contained on this website are provided on an "as-is" basis, are intended only to be informative, is not an advice nor a recommendation, nor research, or a record of our trading prices, or an offer of, or solicitation for a transaction in any financial instrument and thus should not be treated as such. The information provided does not involve any specific investment objectives, financial situation and needs of any specific person who may receive it. Please be aware, that past performance is not a reliable indicator of future performance and/or results. Past Performance or Forward-looking scenarios based upon the reasonable beliefs of the third-party provider are not a guarantee of future performance. Actual results may differ materially from those anticipated in forward-looking or past performance statements. IC Markets makes no representation or warranty and assumes no liability as to the accuracy or completeness of the information provided, nor any loss arising from any investment based on a recommendation, forecast or any information supplied by any third-party.

DXY (LONG)
Elephant in room: To all the fake Business Development Managers in SA; claiming to have database/business they dont have, then jumping broker to broker every 3months to just get money knowing very well you cannot meet the requirement to claim you can
have caused the following
1) International brokers to not hire South Africans anymore
2) Some good brokers to leave the country therefore jobs opportunities to be lost.
We complain about lack of employment and opportunities while we are greatly the cause
Be Better have integrity, professionalism and be hournest, your selfish acts have a greater negative impact than you can imagine.

DXY LOCAL SHORT|
✅DXY is about to retest a key structure level of 98.000
Which implies a high likelihood of a move down
As some market participants will be taking profit from long positions
While others will find this price level to be good for selling
So as usual we will have a chance to ride the wave of a bearish correction
SHORT🔥
✅Like and subscribe to never miss a new idea!✅
Disclosure: I am part of Trade Nation's Influencer program and receive a monthly fee for using their TradingView charts in my analysis.

Dollar Index Analysis – Trump, Hegemony & a Dangerous Disconnect🇺🇸💣 Dollar Index Analysis – Trump, Hegemony & a Dangerous Disconnect 📉⚠️
Hey Traders,
FXPROFESSOR here with a deep-dive update on the Dollar Index (DXY) – and this one hits both technicals and macro geopolitics.
🧠 Macro Context:
For decades, the U.S. strategically outsourced much of its basic manufacturing capacity to China—everything from screws, cables, plastics, and circuit boards. This freed America to focus on high-margin sectors like technology, finance, and defense innovation.
But this efficiency came at a cost: dependency. You can't be the military and economic hegemon of the world if you don’t manufacture your own basic components. That’s the foundation of hard power—and Trump understands this well.
🔁 Now Trump is trying to reverse that.
He knows America can’t win long-term without reclaiming production and export competitiveness – and a strong dollar kills that dream.
So what’s the play?
✅ Trump brings the volatility
✅ Fed stays cautious
✅ Dollar weakens... but without actual rate cuts
That’s the scary part 👇
📉 💵 Dollar Strength vs. Treasury Stress
This is also why the U.S. Treasury market is under stress. If the U.S. wants to rebuild domestic production, reduce trade deficits, and support massive fiscal spending, it needs to weaken the dollar and attract internal capital—not depend on foreign buyers of debt.
A strong dollar = trade imbalance, hollowed industry, and rising debt service costs.
A normalized dollar = controlled exports, internal manufacturing, and a potential realignment of global capital flows.
📉 The Chart: "The Year of the Normalized Dollar"
🟡 This is a continuation of the same chart I published over a year ago.
Key Rejection Zone: 100.965 (former support, now resistance)
Current Trajectory: Approaching my long-held target at 94.677
Macro Message: The dollar is dropping without a Fed pivot
Worrying Signal: If we hit major support while the Fed stays tight... the entire market may need to reprice expectations. That could shake equities and crypto alike.
🧊 This is not a clean-cut dollar short anymore . It’s already priced in, and that’s why I’m spooked.
🧭 What I’m Watching:
Will Trump’s trade war accelerate this move?
Will Powell finally cut in September—or double down?
Will the support at 94.5 hold, or break and open a much larger macro shift?
This chart is no longer just technical. It’s political. It’s strategic. It’s a chessboard for hegemony.
🎥 FULL 20-min video breakdown is now live!
I cover DXY, Bitcoin, tech stocks, gold, silver, DAX, BTC.D and much more
Watch it if you want the full map of what I’m thinking this week.
One Love,
The FXPROFESSOR 💙
Disclosure: I am happy to be part of the Trade Nation's Influencer program and receive a monthly fee for using their TradingView charts in my analysis. Awesome broker, where the trader really comes first! 🌟🤝📈

Macro Moves & Market Reversals: BTC-Metals-Tech-Dollar & more! 🤖📊 Macro Moves & Market Reversals: Bitcoin, Metals, Tech, Dollar & DAX Breakdown 🔥💹
Hey beautiful people,
FXPROFESSOR here with a massive market update to kick off the week. This one’s for my serious traders—those of you ready to read the market like a pro 📚💡
We’re in a critical transition. The Trump–Powell standoff, rate cut games, tariff escalations, and a surprising shift in risk appetite across bonds, metals, and equities are reshaping the entire trading landscape.
Let’s get into the full breakdown 👇
🧠 MACRO FIRST – THE FUNDAMENTAL PULSE
🟢 Interest Rates:
The Fed is keeping rates steady at 4.25%–4.50%, citing strong jobs data. 147K jobs added, unemployment at 4.1%. The market wanted bad news for rate cuts... didn’t get it.
🗓 September remains the most likely cut, but the Fed isn’t rushing. Strong labor = slow policy change.
⚠️ Tariffs Heating Up:
Trump just slapped 25–40% tariffs on imports from Japan, Korea, and others – effective August 1.
➡️ If no political resolution by July 9, prepare for a volatility wave.
Tariffs = supply chain risks + cost-push inflation.
💣 Geopolitics:
Middle East tensions remain background noise, but no major disruptions for now. Still, oil remains sensitive.
📈 Risk Appetite (Bonds):
U.S. Treasuries still lagging, but junk bonds and quality credit (LQD) have pumped. That’s a big clue: risk appetite is returning, even without a Fed pivot.
📉 DOLLAR INDEX (DXY) – "THE YEAR OF THE NORMALIZED DOLLAR"
We’ve followed this dollar short all year.
🔻 From rejection at 100.965, DXY dropped straight into our long-term 94–95 target zone.
📌 Now what? This level is MAJOR. A bounce could trap dollar bears.
🧭 No new short from me unless we re-tag 100+. The juice is squeezed.
Key takeaway:
The dollar already priced in rate cuts, and we didn’t even get them. That’s telling me the next macro move might not be so predictable.
💰 BITCOIN – STILL THE KING
📍 BTC at $115K resistance – a level I’ve charted for years, not weeks.
Three hits:
1️⃣ First rejection
2️⃣ Second rejection
3️⃣ And now... a decisive moment
🚨 Break 115K → BTC flies.
📉 Fail here → we could revisit $64K, yes, seriously. I’m ready for both outcomes.
This is not the time for hopium. It’s 50/50.
🪙 BTC DOMINANCE – THE ALTCOIN SWITCH
BTC.D is now above 65%. That means:
✔️ Capital flowing back into BTC
❌ Altcoins not ready yet
We don’t chase alts until BTC.D hits 71.3–72.9%. That’s the real “altseason trigger zone.”
🔒 I’m personally turned off from alts for now—too much noise, too many memes, not enough macro support.
🔩 PRECIOUS METALS – SHINING BRIGHT
💛 Gold (XAU/USD):
Reached near $3,500 highs
Now stalling
🛑 Taking profits here – caution warranted.
🤍 Silver (XAG/USD):
13-year high
Holding $36+ well
Potential breakout pending global inflation data
💿 Platinum (the sleeper):
+47% YTD
Beautiful long setup played out exactly as planned
Still bullish above $1,400 if supply squeeze continues
💡 ETFs in metals are seeing inflows – more institutions hedging as dollar weakens.
🚗🔌 TECH STOCKS – NVDA, TSLA & THE NASDAQ
📈 NVIDIA (NVDA)
Best trade of the year for me
Clean re-entry, now hitting ATH levels
AI demand + tight supply = rocket fuel
⚡ Tesla (TSLA)
Bounce off 4H trendline
Still lagging slightly – political tensions (Trump vs. Musk) not helping
But levels are working like a charm
📊 NASDAQ (QQQ)
Hit our “max pain” zone perfectly
Rebounded with textbook precision
Momentum intact – watching for new highs
🇩🇪 DAX INDEX – CHARTS DON’T LIE
All-time high. Boom. Called it weeks ago.
Despite:
No Russian energy
Industrial drag
ECB policy constraints
📌 But what worked?
➡️ Simple chart structure.
➡️ Market psychology.
➡️ Pure TA.
Now at resistance again. Watch carefully – support below is clearly defined.
🧾 FINAL THOUGHTS – THE PROFESSOR'S NOTES
🔹 The market’s narrative can change fast, especially with Trump in the mix. He’s Mr. Volatility.
🔹 Powell holds the real power – and right now, he’s not flinching.
🔹 Risk appetite is back – but not evenly. Bitcoin is leading, altcoins are lagging, metals are maturing.
🔹 If rate cuts materialize in September, expect massive rotation across all risk assets.
💭 Until then, I’m playing level-to-level. No FOMO. Just charts and logic. That’s how we survive, and thrive.
Let me know which chart you want next – and thank you for staying sharp 💪📚
One Love,
The FXPROFESSOR 💙
Disclosure: I am happy to be part of the Trade Nation's Influencer program and receive a monthly fee for using their TradingView charts in my analysis. Awesome broker, where the trader really comes first! 🌟🤝📈

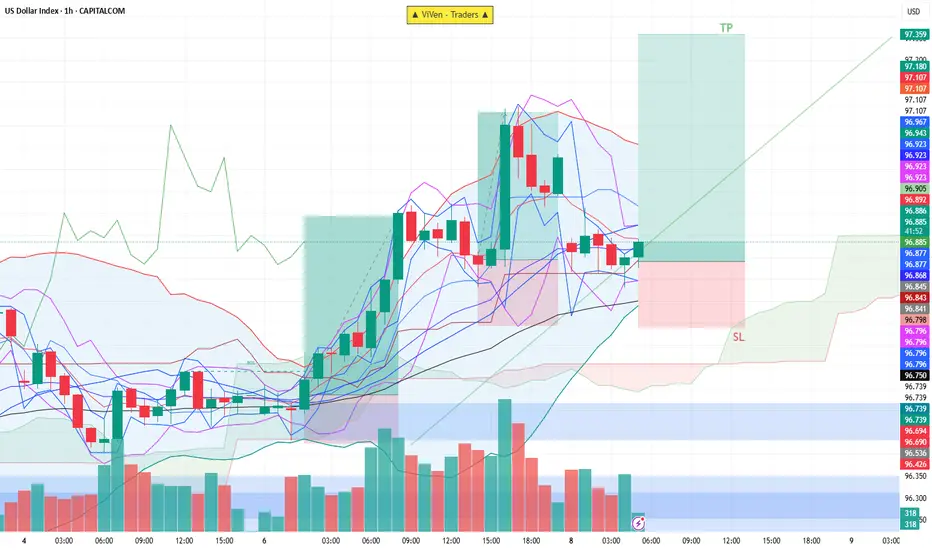
DXY Trade Setup✅ Trade Setup Details:
Entry: 96.850
Stop Loss (SL): 96.650
Take Profit (TP): 97.350
✅ This is a good RRR. A 2.5:1 ratio means you're risking $1 to potentially earn $2.50 — favorable for consistent trading.
📈 Chart & Technical Analysis (based on your image):
✅ Entry is near the middle Bollinger Band and above Ichimoku cloud — a technical support zone.
✅ SL is placed below recent support and Ichimoku base, giving some buffer in case of volatility.
✅ TP at 97.350 aligns with the recent swing high or top of the breakout channel.
⚠️ Things to Watch:
If DXY drops below 96.700, it may signal weakness or a shift in sentiment — watch volume and price reaction.
If price stays above cloud and rising trendline, your trade remains valid.
🟢 Summary:
Bias: Bullish
Setup: Good technical entry with solid support below and clear resistance target.
Risk-to-Reward: Excellent (2.5:1)
Strategy: Hold unless price breaks below 96.650 with volume.
Dollar Index-Stops At Gap ResistanceAfter just a temporary setback in stocks and a brief move higher in the dollar earlier this week, we’re once again seeing a strong reversal across the board. This comes after Donald Trump extended the July 9th tariff deadline to August 1st, giving more time for trade negotiations with various countries. That brought some optimism back into the markets, and if stocks continue to gain, the dollar index is likely to remain in its downtrend.
In fact, the dollar index stopped right at the June 26th gap near the 97.70 resistance level. We believe that the corrective price action from July 1st could now be coming to an end, and the market may resume lower—especially if we get a breakout below the corrective channel support near 97.
GH

Continuation of DXY bullish narrative, who says NO?Like I said in my last published post, dxy is bullish for now till we see otherwise. The first TP has been reached, more than 100 pips bagged, the trade is still on but I'm looking at a possiblity of compounding here. I told you guys, this trade will make you a huge amount of money if you're willing to ride it with me.
This means bearish EURUSD AND GBPUSD et al. Trade accordingly. We may have a final sweep of 97.260 area. You can wait for that sweep before entering. I'm not, I won't be on chart then but the stop will hold. Few pips won't change the trade idea will it?
Follow me as my trades are usually market order, so you'll see them on time and enter on time.
Enjoy

US dollar, Trump has done it!Since the start of 2025, the US dollar has established itself as the weakest major currency on the Forex market, falling by over 11% against a basket of major currencies. If we extend the reference period to include Donald Trump's return to the presidency, the slide even reaches 12%. This spectacular decline is no accident, but the fruit of a strategy deliberately implemented by the Trump administration. The stated aim is clear: to restore the commercial competitiveness of American companies, boost exports and restore the price advantage of products made in the USA. In this respect, the fall of the US dollar on the FX has fulfilled its mission. Can we now envisage a low point for the US dollar on the FX?
1) US dollar: the battle for currency competitiveness has been won for US companies, and this should have a positive impact on the second-quarter results of S&P 500 companies published this July
Indeed, the fall in the dollar translates directly into a much more favorable environment for exporting groups, particularly those which generate the bulk of their sales in Europe or Asia. The conversion of foreign currencies into dollars mechanically boosts revenues and margins. For many multinationals, this factor is likely to contribute to strong earnings releases in the second quarter, as the reporting period takes place this summer. Beyond the immediate impact on corporate accounts, the greenback's depreciation is also encouraging a more structural trend towards reindustrialization and support for domestic production. The effects of this dynamic can already be seen in certain manufacturing segments, which are regaining international market share. Nevertheless, this scenario is not without its downsides: a weak dollar makes imports more expensive, especially raw materials, and weighs on companies dependent on foreign inputs. On the whole, however, the exchange rate policy implemented since January represents a successful gamble by Donald Trump to boost American competitiveness.
2) Technical analysis: can we anticipate a low point for the US dollar?
The crucial question today is whether the US dollar can pull back further, or whether a technical and fundamental bottom is emerging. From a technical analysis point of view, the DXY index, which measures the value of the dollar against a basket of currencies weighted 57% by the euro and 13% by the yen, remains anchored in a bearish trend. Some of the theoretical targets evoked by Elliottist analysis have been reached, but not all. However, long-term supports are visible on monthly charts: an uptrend line, particularly visible on the arithmetic scale, could act as a short-term stabilizer. Note that a potential bullish divergence is also possible on the weekly timeframe. But a bullish reversal pattern is still lacking to speak of a major low point, so let's not put the cart before the horse.
3) Scenarios and stakes for the rest of the year for the US dollar on FX
Beyond technical considerations, the persistent weakness of the US dollar acts as a revealing indicator of the tensions between trade policy and financial stability. On the one hand, a dollar under pressure is a powerful lever for supporting exports and consolidating US growth in an uncertain global context. On the other, a prolonged fall in the greenback fuels concerns about international confidence in dollar-denominated assets, and makes imports more expensive, which could rekindle inflationary pressures. This dilemma lies at the heart of the forthcoming trade-offs between the White House and the Federal Reserve.
For investors and companies exposed to Forex, several scenarios are conceivable. If the U.S. political agenda leads to a trade compromise, and if second-quarter publications confirm the robustness of the U.S. economy, the dollar is likely to find a technical floor around the supports identified on the DXY. In this scenario, a stabilization phase, or even a moderate rebound, could set in during the second half of the year. Conversely, if the trade stimulus policy is accompanied by a hardening of relations with Europe and China, or if the Fed is slow to react, the downward momentum could be prolonged.
DISCLAIMER:
This content is intended for individuals who are familiar with financial markets and instruments and is for information purposes only. The presented idea (including market commentary, market data and observations) is not a work product of any research department of Swissquote or its affiliates. This material is intended to highlight market action and does not constitute investment, legal or tax advice. If you are a retail investor or lack experience in trading complex financial products, it is advisable to seek professional advice from licensed advisor before making any financial decisions.
This content is not intended to manipulate the market or encourage any specific financial behavior.
Swissquote makes no representation or warranty as to the quality, completeness, accuracy, comprehensiveness or non-infringement of such content. The views expressed are those of the consultant and are provided for educational purposes only. Any information provided relating to a product or market should not be construed as recommending an investment strategy or transaction. Past performance is not a guarantee of future results.
Swissquote and its employees and representatives shall in no event be held liable for any damages or losses arising directly or indirectly from decisions made on the basis of this content.
The use of any third-party brands or trademarks is for information only and does not imply endorsement by Swissquote, or that the trademark owner has authorised Swissquote to promote its products or services.
Swissquote is the marketing brand for the activities of Swissquote Bank Ltd (Switzerland) regulated by FINMA, Swissquote Capital Markets Limited regulated by CySEC (Cyprus), Swissquote Bank Europe SA (Luxembourg) regulated by the CSSF, Swissquote Ltd (UK) regulated by the FCA, Swissquote Financial Services (Malta) Ltd regulated by the Malta Financial Services Authority, Swissquote MEA Ltd. (UAE) regulated by the Dubai Financial Services Authority, Swissquote Pte Ltd (Singapore) regulated by the Monetary Authority of Singapore, Swissquote Asia Limited (Hong Kong) licensed by the Hong Kong Securities and Futures Commission (SFC) and Swissquote South Africa (Pty) Ltd supervised by the FSCA.
Products and services of Swissquote are only intended for those permitted to receive them under local law.
All investments carry a degree of risk. The risk of loss in trading or holding financial instruments can be substantial. The value of financial instruments, including but not limited to stocks, bonds, cryptocurrencies, and other assets, can fluctuate both upwards and downwards. There is a significant risk of financial loss when buying, selling, holding, staking, or investing in these instruments. SQBE makes no recommendations regarding any specific investment, transaction, or the use of any particular investment strategy.
CFDs are complex instruments and come with a high risk of losing money rapidly due to leverage. The vast majority of retail client accounts suffer capital losses when trading in CFDs. You should consider whether you understand how CFDs work and whether you can afford to take the high risk of losing your money.
Digital Assets are unregulated in most countries and consumer protection rules may not apply. As highly volatile speculative investments, Digital Assets are not suitable for investors without a high-risk tolerance. Make sure you understand each Digital Asset before you trade.
Cryptocurrencies are not considered legal tender in some jurisdictions and are subject to regulatory uncertainties.
The use of Internet-based systems can involve high risks, including, but not limited to, fraud, cyber-attacks, network and communication failures, as well as identity theft and phishing attacks related to crypto-assets.

Bullish for DXY, tuesday trading still bullish on dxy, two areas of interest are those two 4hr fvg shown. Thier is also sellside liquidity , whcih we can sweep or we can have a deeper retracement, and touch the second fvg. I am still expecting a bullish dollar for the week, even tho my weekly objective has been met. The US10Y looks really strong and the u.s trasury bonds look week. The only thing is that if you look at the eurusd chart, we have equal highs, so that can be something to watch.
