DXY... 1H chat patternHere's a breakdown of your DXY trade idea with the proposed parameters:
### 🟩 *Trade Setup:*
* *Instrument*: U.S. Dollar Index (DXY)
* *Position*: Long (Buy)
* *Entry*: 100.00
* *Take Profit (TP)*: 100.80
* *Stop Loss (SL)*: 99.38
### 📊 *Trade Metrics:*
* *Risk (Stop Loss): 100.00 − 99.38 = **0.62*
* *Reward (Take Profit): 100.80 − 100.00 = **0.80*
* *Risk-Reward Ratio (RRR): **0.80 / 0.62 ≈ 1.29*
### ✅ *Pros:*
* Favorable *RRR > 1*, though ideally 2:1 is preferred.
* Buying near the *psychological round number* of 100.00.
* SL is below the identified support at 99.48 and 99.37, offering cushion.
* Target is reasonable and aligns with short-term resistance zones (based on technicals).
### ⚠ *Risks / Considerations:*
* DXY is currently range-bound and sensitive to macroeconomic events (e.g., NFP, Fed speakers).
* SL at 99.38 is slightly wide (\~62 pips), make sure your position size reflects this to manage risk.
* Watch for fakeouts around 100.00 as it’s a key level traders target for stop hunts.
### 🧠 *Final Take:*
Your setup is technically valid and reasonably structured. Just ensure you're accounting for volatility—especially if this trade is held over high-impact news events.
USDINDEX trade ideas
USD - Early Stages of a Low?The FOMC rate decision next week will likely have some pull on the matter but for now, the US Dollar is working on its second consecutive green week for the first time since the high in January. Resistance has so far held at last year's swing low of 100.22 but bulls put in some push over the past week and it seems unlikely that the Fed will suddenly go dovish given the overhang of tariff uncertainty.
Notably, the oversold RSI reading on the weekly has started to rectify with the indicator crossing up and over the 30-level. - js

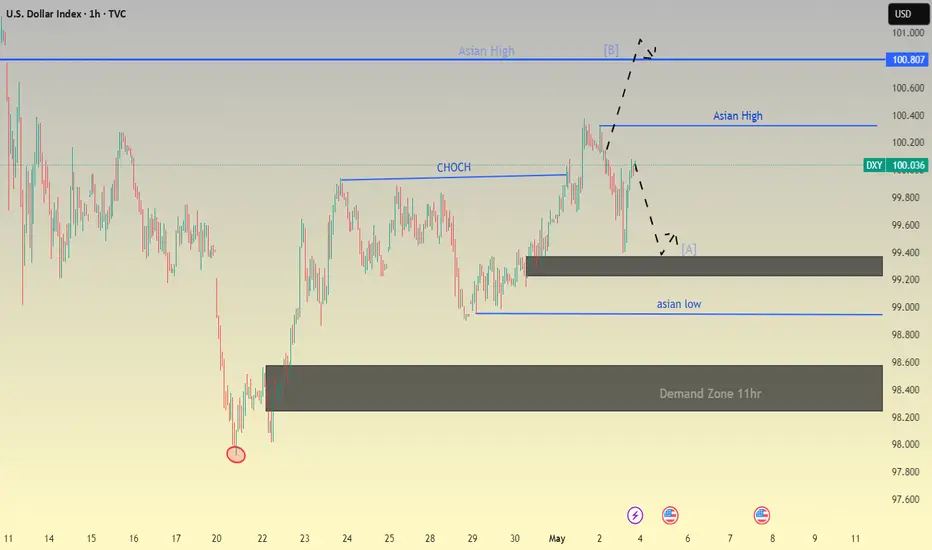
DXY (Dollar index) Shorts from 1hr supply zone My general outlook on the DXY this week leans bearish, as I expect price to continue trending lower. I’ve identified a nearby 1H supply zone, where we could see price react and begin pushing lower. There is also a larger supply zone further above, but it’s currently out of reach unless price pulls back significantly.
Looking back, the 2-day demand zone I marked over a week ago has played out well, with a strong bullish reaction from that level — price is still rising from that zone. During this move, a new 11H demand zone has formed, which also led to a change of character to the upside. If price revisits that zone, we may see another bullish continuation from there.
Key Points:
Overall bearish trend expected to continue in the short term.
1H supply zone nearby is a potential trigger point for a sell-off.
2D demand zone previously marked is still holding and influencing price.
11H demand zone has caused a bullish shift and could provide another long opportunity if price returns.
P.S. This is my general DXY outlook for the week. I don’t trade the dollar directly, but I use it as a key confluence when analysing and executing trades across other major pairs.

DOLLARDXY and Bond Yield Correlation: Key Dynamics in 2025
Core Relationship
The US Dollar Index (DXY) and US 10-Year Treasury yields exhibit a positive correlation, driven by shared sensitivity to Federal Reserve policy, inflation expectations, and global risk sentiment.
Fed Rate Hikes Strengthens USD (DXY ↑) and pushes yields higher
Strong US Growth Bolsters USD and raises yields via inflation risks
Risk-On Sentiment Weakens USD and lowers yields as capital flows to riskier assets
Inflation Fears Raises yields but may not always lift USD if growth concerns dominate
Current Correlation Metrics (2025)
DXY and 10-Year Yield Correlation: Historically positive, with recent coefficients ranging from +0.50 to +0.93 depending on market conditions.
USD/JPY and Yields: Extreme correlation of +0.93 in 2025, reflecting synchronized moves between the dollar and yields.
Key Drivers in 2025
Monetary Policy:
The Fed’s restrictive stance (4.50% rate) supports both USD and yields, but delayed cuts and tariff-induced inflation risks create volatility.
ECB and BoJ dovishness amplifies USD strength, reinforcing the correlation.
Economic Data:
Robust US GDP growth (0.4% Q1 2025) and sticky inflation (2.1% in Germany) keep yields elevated, supporting DXY.
Weakness in global markets (e.g., China, EU) drives safe-haven flows into USD and Treasuries, complicating the correlation.
Fiscal and Geopolitical Risks:
US fiscal deficit concerns and trade tensions (e.g., U.S.-China tariffs) threaten to decouple DXY from yields. For example, rising yields due to debt supply fears may coincide with USD weakness if investors flee US assets.
Bond market turbulence (10-Year yields at 4.47% in April 2025) highlights sensitivity to foreign demand and leverage unwinds.
Exceptions and Divergences
Risk-Off Scenarios: In crises, investors may buy both Treasuries (lowering yields) and USD, creating a temporary negative correlation.
De-Dollarization Fears: Structural shifts, such as reduced foreign appetite for US debt, could weaken the link between DXY and yields despite high rates.
2025 Outlook
Yield Range: Expected to stabilize between 4%–5%, supporting a firm USD if Fed policy remains hawkish.
DXY Trajectory: Faces headwinds from fiscal risks and tariffs but could rebound if global growth slows and US data stays resilient.
Summary Table
Correlation Positive (DXY ↑ as yields ↑), but context-dependent
Fed Policy Primary driver; higher rates lift both DXY and yields
Inflation Supports yields, but may weaken USD if growth falters
Global Risk Risk-off flows can strengthen USD while lowering yields
2025 Risks Fiscal deficits, tariffs, and de-dollarization may disrupt correlation
In conclusion, while DXY and bond yields generally move in tandem, 2025’s unique mix of monetary policy, fiscal strains, and geopolitical shifts introduces volatility. Traders should monitor Fed rhetoric, inflation data, and global risk appetite for directional cues.

Bearish forecast for DXYWith regards my previous forecast, we have a strong reaction from Weekly and daily premium arrays.
On the weekly TF, we have IOFED of the SIBI and BSL above previous 2 weeks' highs was taken.
Tf: time frame
IOFED: Institutional Order Flow Express Entry Drill
SIBI: Sellside Imbalance, Buyside Inefficiency.
BSL: Buy side liquidity

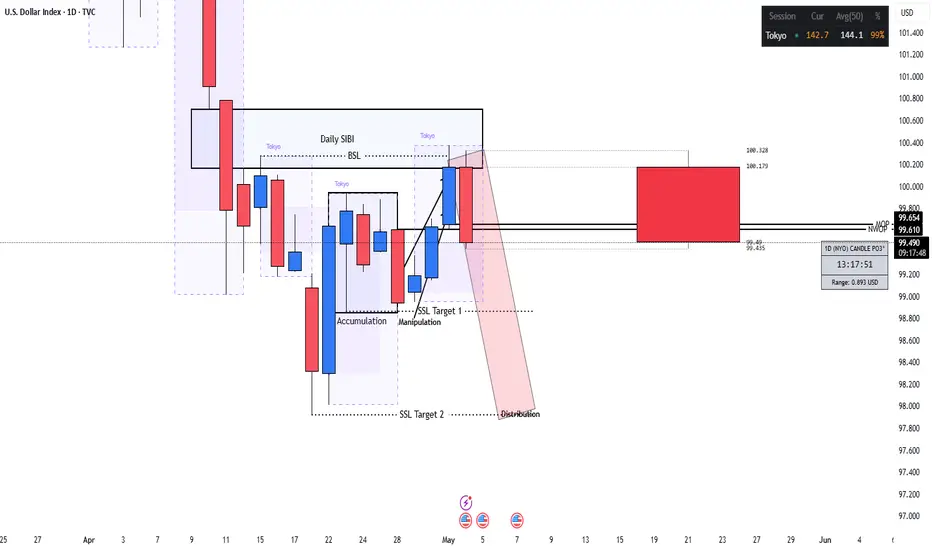
DXY Bearish Forecast for Quarter 2, 20251. Technical analysis
The idea is based in ICT's PO3; AMD pattern.
We have a rally above the open price of May 2025, to take out BSL above the highs.
It also aligns with Daily tf premium arrays to short from.
The lowest hanging fruit being the relative equal lows at equilibrium of the dealing range.
2. Fundamental analysis
Investor's confidence in the Dollar is low due to POTUS' tariffs.
ICT: Inner Circle Trader
PO3: Power of 3
AMD: Accumulation, Manipulation & Distribution
BSL: Buy side liquidity
tf: Timeframe

USD Is Bullish Short Term. Short The Majors! This is the FOREX outlook for the week of April 28 - May 2nd.
In this video, we will analyze the following FX markets:
USD Index
EUR
GBP
AUD
NZD
CAD, USDCAD
CHF, USDCHF
JPY, USDJPY
The USD Index is heading up towards a bearish FVG. The EURUSD, GBPUSD, and the other Major pairs will be pulled down by this price action .... until the USD hits it's POI. Then things will get interesting!
Take advantage of the USD push higher!
Remember, NFP is Friday! Be careful of wonky price action on Thursday and Friday.
Enjoy!
May profits be upon you.
Leave any questions or comments in the comment section.
I appreciate any feedback from my viewers!
Like and/or subscribe if you want more accurate analysis.
Thank you so much!
Disclaimer:
I do not provide personal investment advice and I am not a qualified licensed investment advisor.
All information found here, including any ideas, opinions, views, predictions, forecasts, commentaries, suggestions, expressed or implied herein, are for informational, entertainment or educational purposes only and should not be construed as personal investment advice. While the information provided is believed to be accurate, it may include errors or inaccuracies.
I will not and cannot be held liable for any actions you take as a result of anything you read here.
Conduct your own due diligence, or consult a licensed financial advisor or broker before making any and all investment decisions. Any investments, trades, speculations, or decisions made on the basis of any information found on this channel, expressed or implied herein, are committed at your own risk, financial or otherwise.

DXY Bullish Based on price Action, this is a swing long with a 1:4 RR
Target is there as we have pending buy side liquidity that was left for future run
Dollar Outlook Ahead of Jobs ReportThe dollar index is attempting a comeback, but the 100.20–100.50 zone has so far formed a strong resistance. Today’s jobs report will be key for determining the short-term direction.
Nonfarm payrolls are expected to rise by 138k. This could be the last relatively strong report before the effects of tariffs begin to weigh on the labor market. Leading indicators already show significant pressure on trade and transportation employment, though the full impact is likely to emerge in future reports. Still, we may see early signs of softness today.
As the economy comes out of winter, there could be some temporary strength in weather-sensitive sectors. Overall, I expect a slight beat in today’s nonfarm payrolls data. If unemployment also holds at 4.2%, the dollar could respond positively. Positive reaction to the payrolls data usually do not pass around 1% gains.
An interesting detail: TVC:DXY has risen after each of the last eight jobs reports, regardless of whether the data was strong or weak. That trend might end today, though, as the dollar is no longer in an established uptrend.
If the 100.20–100.50 resistance zone breaks, the dollar could climb toward 101.50 in the coming days. However, the broader outlook remains negative.
Please check our longer-term analysis here:

possibity of uptrendAs long as the index fluctuates above the support area, the upward trend will likely continue. Otherwise, the correction will continue to the specified support levels.

DXY Will Fall! Sell!
Hello,Traders!
DXY keeps strengthening
These last days and the index
Has almost reached a horizontal
Resistance level of 100.500
From where we will be expecting
A local bearish pullback and
A local move down
Sell!
Comment and subscribe to help us grow!
Check out other forecasts below too!
Disclosure: I am part of Trade Nation's Influencer program and receive a monthly fee for using their TradingView charts in my analysis.

Review and plan for 2nd May 2025Nifty future and banknifty future analysis and intraday plan.
Quarterly results.
This video is for information/education purpose only. you are 100% responsible for any actions you take by reading/viewing this post.
please consult your financial advisor before taking any action.
----Vinaykumar hiremath, CMT

USDX,DXYUSDX price is near the important support zone 98.23-97.75. If the price cannot break through the 97.75 level, it is expected that in the short term there is a chance that the price will rebound.
**Very Risky Trade
🔥Trading futures, forex, CFDs and stocks carries a risk of loss.
Please consider carefully whether such trading is suitable for you.
>>GooD Luck 😊
❤️ Like and subscribe to never miss a new idea!

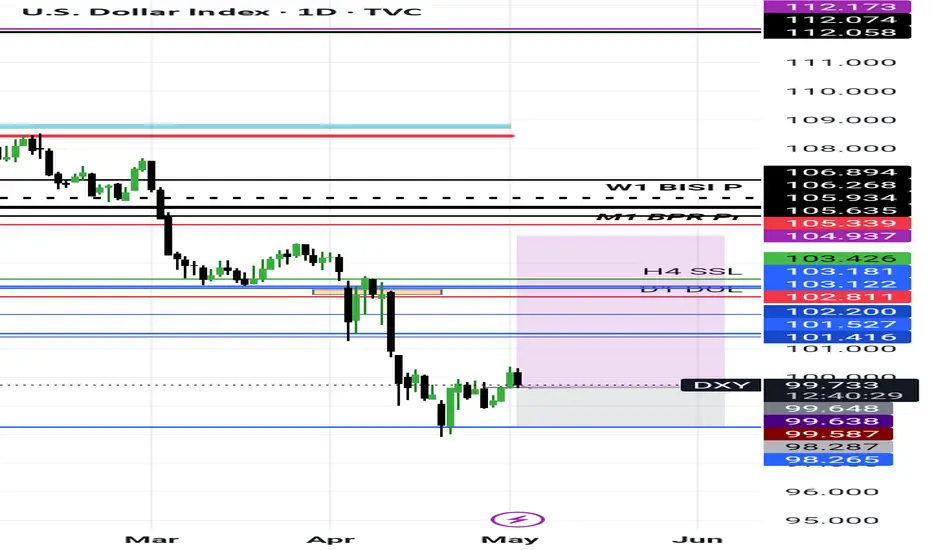
US Dollar Bulls Return Ahead of NFPsThe US Dollar is testing resistance today at the 2023 / 2024 low day closes (LDC) at 99.95-100.42- looking for possible infection off this mark in the days ahead.
A closer look at USD price action shows the index trading into the resistance at the median-line in early U.S. trade. A topside breach above this threshold is needed to validate a breakout of the weekly opening-range with subsequent resistance see at the September high-day close (HDC) / September high at 101.77/92. Note that channel resistance converges on this threshold over the next few weeks and a breach / close above this slope would be needed to suggest a more significant low was registered last week / a larger reversal is underway. Subsequent resistance eyed at the 2016 high-close / 2020 high at 102.95/99 and the 2023 yearly open at 103.49.
Key support remains unchanged at the 2018 swing high / 61.8% retracement of the 2018 advance at 97.71-98.39- a close below this threshold would threaten another bout of accelerated USD losses with subsequent support seen at the 96-handle, the 2022 LDC at 95.17 and the March 2020 low at 94.65.
A rebound off key support takes the U.S. Dollar into initial resistance with major event risk on tap tomorrow. From a trading standpoint, losses should be limited to this week’s low IF price is heading higher on this stretch with a breach above 100.42 needed to fuel the next leg of the recovery.
-MB

DXY Analysis: Head & Shoulders or a Bull Trap? Despite a notable contraction in U.S. GDP and a sharp drop in Core PCE — both pointing to increasing recession risk — the U.S. Dollar Index (DXY) managed to sustain its rebound.
On the 4-hour chart, DXY is pushing above the neckline of an inverted head-and-shoulders formation. However, confirmation is still needed — a clean hold above 100.30 is essential to avoid a bull trap.
Upside Levels in Sight (if 100.30 holds):101.30 - 102.00 - 103.50
Downside Risk (if neckline fails):99.30 - 98.90 - 98.00
From a monthly perspective, DXY is holding above the 98 support and remains above the lower border of the up-trending channel extending from the 2008 lows, paving the way for another possible drop this year towards that border should the 98-support be decisively breached.
From a daily momentum perspective, the overall picture may signal a short-term trend reset before markets regain directional clarity
Written by Razan Hilal, CMT
